مقاطعة سان دييغو، كاليفورنيا
San Diego County | |
|---|---|
| County of San Diego | |
      Images, from top down, left to right: F/A-18 Hornet flying over San Diego, Mission San Diego de Alcalá, San Diego State University's Hepner Hall, Hotel del Coronado's main building, Torrey Pines State Natural Reserve, Jacumba Mountains | |
 Flag  الشعار | |
 Location in the U.S. state of California | |
 California's location in the United States | |
| الإحداثيات: 33°01′N 116°46′W / 33.02°N 116.77°W | |
| Country | United States |
| State | California |
| Formed | February 18, 1850[1] |
| السمِيْ | San Diego de Alcalá |
| County seat | San Diego |
| Largest city | San Diego |
| الحكومة | |
| • النوع | Council–manager |
| • الكيان | Board of Supervisors |
| • Board of Supervisors[3] |
|
| • Chief Administrative Officer | Helen Robbins-Meyer[2] |
| • District Attorney | Summer Stephan |
| المساحة | |
| • الإجمالي | 4٬526 ميل² (11٬720 كم²) |
| • البر | 4٬207 ميل² (10٬900 كم²) |
| • الماء | 319 ميل² (830 كم²) |
| أعلى منسوب | 6٬536 ft (1٬992 m) |
| التعداد | |
| • الإجمالي | 3٬095٬313 |
| • Estimate (2019)[6] | 3٬338٬330 |
| • الكثافة | 680/sq mi (260/km2) |
| منطقة التوقيت | UTC−08:00 (Pacific Time Zone) |
| • الصيف (التوقيت الصيفي) | UTC−07:00 (Pacific Daylight Time) |
| Area codes | 442/760, 619, 858, and 949 |
| FIPS code | 06-073 |
| GDP | $219 billion[7] |
| GDP per capita | $65,602 |
| الموقع الإلكتروني | www |
مقاطعة سان دييگو إنگليزية: San Diego County هي مقاطعة في الركن الجنوبي الغربي لولاية كاليفورنيا في الولايات المتحدة. As of the 2010 census, the population was 3,095,313,[5] making it California's second-most populous county and the fifth-most populous in the United States. Its county seat is San Diego,[8] the eighth-most populous city in the United States. It is the southwesternmost county in the 48 contiguous United States, and is a border county.
San Diego County comprises the San Diego-Chula Vista-Carlsbad, CA Metropolitan Statistical Area,[9] which is the 17th most populous metropolitan statistical area and the 18th most populous primary statistical area of the United States as of July 1, 2012.[10][11] San Diego is also part of the San Diego–Tijuana metropolitan area, the largest metropolitan area shared between the United States and Mexico. Greater San Diego truly ranks as the 38th largest metropolitan area in the Americas.
San Diego County has more than 70 ميل (113 km) of coastline. This forms the most densely populated region of the county, which has a mild Mediterranean to semiarid climate and extensive chaparral vegetation, similar to the rest of the western portion of southern California. Precipitation and temperature extremes increase to the east, with mountains that receive frost and snow in the winter.[12] These lushly forested mountains receive more rainfall than average in southern California, while the desert region of the county lies in a rain shadow to the east, which extends into the Desert Southwest region of North America.
There are also 16 naval and military installations of the U.S. Navy, U.S. Marine Corps, and the U.S. Coast Guard in San Diego County. These include the Naval Base San Diego, Marine Corps Base Camp Pendleton, Marine Corps Air Station Miramar, and Naval Air Station North Island.
From north to south, San Diego County extends from the southern borders of Orange and Riverside Counties to the Mexico-U.S. border and the Baja California municipalities of Tijuana and Tecate. From west to east, San Diego County stretches from the Pacific Ocean to its boundary with Imperial County, which separated from it in 1907.
التاريخ
The area which is now San Diego County has been inhabited for more than 12,000 years by Kumeyaay (also called Diegueno and Ipai/Tipai), Luiseño, Cupeño and Cahuilla Indians and their local predecessors.[13]
In 1542, the explorer Juan Rodríguez Cabrillo, who may have been born in Portugal but sailed on behalf of Spain, claimed San Diego Bay for the Spanish Empire, and he named the site San Miguel.[14] In November 1602, Sebastián Vizcaíno surveyed the harbor and what are now Mission Bay and Point Loma and named the area for Saint Didacus, a Spaniard more commonly known as San Diego.[15] European settlement in what is now San Diego County began with the founding of the San Diego Presidio and Mission San Diego de Alcalá by Spanish soldiers and clerics in 1769.[16] This county was part of Alta California under the Viceroyalty of New Spain until the Mexican declaration of independence. From 1821 through 1848 this area was part of Mexico.
San Diego County became part of the United States as a result of the Treaty of Guadalupe Hidalgo in 1848, ending the Mexican–American War. This treaty designated the new border as terminating at a point on the Pacific Ocean coast which would result in the border passing one Spanish league south of the southernmost portion of San Diego Bay, thus ensuring that the United States received all of this natural harbor.
San Diego County was one of the original counties of California, created at the time of California statehood in 1850.[17]
الجغرافيا

According to the U.S. Census Bureau, the county has an area of 4،526 ميل مربع (11،720 km2), of which 4،207 ميل مربع (10،900 km2) is land and 319 ميل مربع (830 km2) (7.0%) is water.[18] The county is larger in area than the combined states of Rhode Island and Delaware.[19]
الطقس

Under the Köppen climate classification system, the urban and suburban San Diego area straddles areas of Mediterranean climate (CSa) to the north and semi-arid climate (BSh) to the south and east.[20] As a result, it is often described as "arid Mediterranean" and "semi-arid steppe." Farther east, arid desert conditions prevail. Western San Diego's climate is characterized by warm, dry summers and mild winters with most of the annual precipitation falling between November and March. The city has mild, mostly dry weather, with an average of 201 days above 70 °F (21 °C) and low rainfall (9–13 بوصات (23–33 cm) annually). Summer temperatures are generally warm, with average highs of 70–78 °F (21–26 °C) and lows of 55–66 °F (13–19 °C). Temperatures exceed 90 °F (32 °C) only four days a year. Most rainfall occurs from November to April. Winter temperatures are mild, with average high temperatures of 66–70 °F (19–21 °C) and lows of 50–56 °F (10–13 °C).
Adjacent counties and municipalities


Bays and lagoons
Lakes
- Lake Cuyamaca
- Lake Hodges
- Santee Lakes
- Sweetwater Reservoir
- Upper Otay Reservoir
- Lower Otay Reservoir
- Lake Wohlford
- El Capitan Reservoir
- Sutherland Reservoir
- Lake Henshaw
- Lake Murray
- San Vicente Reservoir
- Lake Jennings
- Barrett Dam
- Natural Rock Tanks
- Little Laguna Lake
- Big Laguna Lake
- Big Lake
- Twin Lakes
- Jean Lake
- Lost Lake
- Swan Lake
- Lake Miramar
- Lake Poway
- Dixon Lake
- Lindo Lake
الأنهار
- San Diego River
- San Luis Rey River
- San Dieguito River
- Sweetwater River
- Otay River
- Tijuana River
- Santa Margarita River
السكان
Since at least 2014, San Diego County is the fifth most populous county in the United States.[21] In 2000, only about 3% of San Diego County residents left the county for work while 40,000 people commuted into the metropolitan area.[22]
| Population, race, and income (2011) | |||||
|---|---|---|---|---|---|
| Total population[23] | 3,060,849 | ||||
| White[23] | 2,182,604 | 71.3% | |||
| Hispanic or Latino (of any race)[24] | 967,858 | 31.6% | |||
| Asian[23] | 333,314 | 10.9% | |||
| Black or African American[23] | 154,076 | 5.0% | |||
| American Indian or Alaska Native[23] | 20,597 | 0.7% | |||
| Native Hawaiian or other Pacific Islander[23] | 14,266 | 0.5% | |||
| Some other race[23] | 220,000 | 7.2% | |||
| Two or more races[23] | 135,992 | 4.4% | |||
| Per capita income[25] | $30,955 | ||||
| Median household income[26] | $63,857 | ||||
| Median family income[27] | $74,633 | ||||
| التعداد | Pop. | ملاحظة | %± |
|---|---|---|---|
| 1850 | 798 | — | |
| 1860 | 4٬324 | 441٫9% | |
| 1870 | 4٬951 | 14٫5% | |
| 1880 | 8٬018 | 61٫9% | |
| 1890 | 34٬987 | 336٫4% | |
| 1900 | 35٬090 | 0٫3% | |
| 1910 | 61٬665 | 75٫7% | |
| 1920 | 112٬248 | 82�0% | |
| 1930 | 209٬659 | 86٫8% | |
| 1940 | 289٬348 | 38�0% | |
| 1950 | 556٬808 | 92٫4% | |
| 1960 | 1٬033٬011 | 85٫5% | |
| 1970 | 1٬357٬854 | 31٫4% | |
| 1980 | 1٬861٬846 | 37٫1% | |
| 1990 | 2٬498٬016 | 34٫2% | |
| 2000 | 2٬813٬833 | 12٫6% | |
| 2010 | 3٬095٬313 | 10�0% | |
| 2019 (تق.) | 3٬338٬330 | [6] | 7٫9% |
| U.S. Decennial Census[28] 1790–1960[29] 1900–1990[30] 1990–2000[31] 2010–2018[5] | |||
Race
The 2010 United States Census reported that San Diego County had a population of 3,095,313. The racial makeup of San Diego County was 1,981,442 (64.0%) White, 158,213 (5.1%) African American, 26,340 (0.9%) Native American, 336,091 (10.9%) Asian (4.7% Filipino, 1.6% Vietnamese, 1.4% Chinese, 3.2% Other Asian), 15,337 (0.5%) Pacific Islander, 419,465 (13.6%) from other races, and 158,425 (5.0%) from two or more races. Hispanic or Latino of any race were 991,348 persons (32.0%).[32] Including those of mixed race, the total number of residents with Asian ancestry was 407,984.[33]
As of 2009, the racial makeup of the county was 79.4% White American, 5.6% Black or African American, 1% Native American, 10.4% Asian, 0.5% Pacific Islander, 10.3% from other races, and 3.6% from two or more races. 31.3% of the population were Hispanic or Latino of any race.
67.0% spoke only English at home; 21.9% spoke Spanish, 3.1% Tagalog and 1.2% Vietnamese.
Other demographics
As of 2018 Census Bureau estimates, there were 3,343,364 people, 1,067,846 households, and 663,449 families residing in the county. The population density was 670 people per square mile (259/km2). There were 1,142,245 housing units at an average density of 248 per square mile (96/km2).
In 2000 there were 994,677 households, out of which 33.9% had children under the age of 18 living with them, 50.7% were married couples living together, 11.6% had a female householder with no husband present, and 33.3% were non-families. 24.2% of all households were made up of individuals, and 7.9% had someone living alone who was 65 years of age or older. The average household size was 2.73 and the average family size was 3.29.
As of 2000, in the county the population was spread out, with 25.7% under the age of 18, 11.30% from 18 to 24, 32.0% from 25 to 44, 19.8% from 45 to 64, and 11.2% who were 65 years of age or older. The median age was 33 years. For every 100 females, there were 101.2 males. For every 100 females age 18 and over, there were 99.7 males.
In 2012, it was estimated that there were 198,000 unauthorized immigrants; the origin of the plurality of them is Mexico.[34]
In 2018, the median household income was $70,824; most people spend more than 30% of their income on housing costs.[35] In August of that year, the median home price was $583,000; this is lower than the median home price in Los Angeles, and Orange counties.[36]
Income
According to the 2000 Census, the median income for a household in the county was $47,067, and the median income for a family was $53,438. Males had a median income of $36,952 versus $30,356 for females. The per capita income for the county was $22,926. About 8.9% of families and 12.4% of the population were below the poverty line, including 16.5% of those under age 18 and 6.8% of those age 65 or over.
Much of the county's high-income residents are concentrated in the northern part of the city of San Diego. The San Diego metropolitan area has two places with both a population of over 50,000 and a per capita income of over $40,000: Carlsbad and Encinitas.
The county's largest continuous high-income urban area is a triangle from a first point on the northern edge of Carlsbad, a second point southeast of Escondido, and a third point on the southern edge of La Jolla. It contains all or most of the cities of Carlsbad, Encinitas, Solana Beach, Del Mar, and Poway in addition to a substantial portion of northern San Diego.[37]
Homelessness
According to a Point-In-Time count taken for the San Diego Regional Task Force on the Homeless, there were 8,576 homeless individuals on January 6, 2018, a 6% decrease from 2017. 3,586 were sheltered, and 4,990 were not. 4,912 (75.3%) were in the City of San Diego. North County Inland had 1,153 (13.4%), North County Coastal with 822 homeless (9.6%), 602 (7%) were found in South County, and 1,087 (12.7%) in East County.[38]
Religion
According to the Pew Research Center اعتبارا من 2014[تحديث], 68% of adults in the county are Christian, of whom 32% are Catholic. 27% were unaffiliated, and 5% adhered to a Non-Christian faith.[39] According to the University of Southern California, in 2010, the largest faith in the county was Catholicism, followed by Nondenominational Christians, and Mormons.[40]
In 2014, the county had 978 religious organizations, the seventh most out of all US counties.[41]
Immigration Data
In 2014 according to Pew Research Center, there are about 170,000 individuals who immigrated to the United States without authorization living in the region.[42] San Diego has been a destination for trafficked minors from Mexico and the Philippines.[43] In 2018, the United States Border Patrol caught an average of over a hundred individuals crossing the border illegally each day.[44]
Economy
San Diego County and Imperial County are part of the Southern Border Region, one of nine such regions. As a regional economy, the Southern Border Region is the smallest but most economically diverse region in the state. However, the two counties maintain weak relations and have little in common aside from their common border.[45] The region has a high cost of living.[46] This includes the highest cost of water in the United States.[47] اعتبارا من 2018[تحديث], San Diego County is within the top ten highest cost of rent in the United States;[48] this has led to people moving out of the county.[49]
Culture
The culture of San Diego is influenced heavily by American and Mexican cultures due to its position as a border town, its large Hispanic population, and its history as part of Spanish America and Mexico. The area's longtime association with the U.S. military also contributes to its culture. Present-day culture includes many historical and tourist attractions, a thriving musical and theatrical scene, numerous notable special events, a varied cuisine, and a reputation as one of America's premier centers of craft brewing.
Government

The Government of San Diego County is defined and authorized under the California Constitution, California law, and the Charter of the County of San Diego.[50] Much of the Government of California is in practice the responsibility of county governments such as the Government of San Diego County. The County government provides countywide services such as elections and voter registration, law enforcement, jails, vital records, property records, tax collection, public health, and social services. In addition the County serves as the local government for all unincorporated areas.[51] Some chartered cities such as San Diego and Chula Vista provide municipal services such as police, public safety, libraries, parks and recreation, and zoning. Other cities such as Del Mar and Vista arrange to have the County provide some or all of these services on a contract basis.
The county government is composed of the elected five-member Board of Supervisors, several other elected offices and officers
| Office | Official | Party |
|---|---|---|
| Clerk | Ernest J. Dronenburg Jr. | Republican |
| District Attorney | Summer Stephan | Republican |
| Sheriff | William Gore | Republican |
| Treasurer | Dan McAllister | Republican |
and numerous county departments and entities under the supervision of the Chief Administrative Officer such as the Probation Department. In addition, several entities of the government of California have jurisdiction conterminous with San Diego County, such as the San Diego Superior Court.
Politics
| San Diego County registered voters (2014)[52] | ||
|---|---|---|
| Total population[23] | 3,060,849 | |
| Registered voters[52][note 1] | 1,530,462 | 50.0% |
| Democratic | 531,941 | 34.8% |
| Republican | 503,639 | 32.9% |
| Democratic–Republican spread | +28,302 | +1.9% |
| No party preference | 412,807 | 27.0% |
| American Independent | 52,088 | 3.4% |
| Libertarian | 12,484 | 0.8% |
| Green | 7,668 | 0.5% |
| Other | 5,695 | 0.4% |
| Peace and Freedom | 4,140 | 0.3% |
As of February 2019, there are 1,747,383 registered voters in San Diego County. Of those, 623,925 (35.7%) are registered Democratic, 475,149 (27.3%) are registered Republican, 552,538 (31.6%) declined to state a political party, 55,800 (3.2%) are registered American Independence Party, 16,355 (0.9%) are registered Libertarian, 6,887 (0.4%) are registered Green, and 5,255 (0.3%) are registered Peace & Freedom.[53]
Voting
San Diego County has historically been a Republican stronghold. The Republican presidential nominee carried the county in every presidential election from 1948 through 2004, except in 1992 when Bill Clinton won a plurality. In 2008, Barack Obama became the first Democratic presidential candidate to win a majority of votes in San Diego County since World War II; he won a majority of county votes again in 2012. In 2016, the county voted in favor of the Democratic presidential nominee Hillary Clinton by 19.7%, the largest margin for a Democrat since 1936.
| Year | GOP | DEM | Others |
|---|---|---|---|
| 2016 | 36.57% 477,766 | 56.30% 735,476 | 7.13% 93,158 |
| 2012 | 44.95% 536,726 | 52.51% 626,957 | 2.53% 30,266 |
| 2008 | 43.79% 541,032 | 53.95% 666,581 | 2.26% 27,890 |
| 2004 | 52.45% 596,033 | 46.33% 526,437 | 1.22% 13,881 |
| 2000 | 49.63% 475,736 | 45.66% 437,666 | 4.71% 45,232 |
| 1996 | 45.57% 402,876 | 44.11% 389,964 | 10.33% 91,311 |
| 1992 | 35.69% 352,125 | 37.24% 367,397 | 27.08% 267,124 |
| 1988 | 60.19% 523,143 | 38.34% 333,264 | 1.47% 12,788 |
| 1984 | 65.30% 502,344 | 33.41% 257,029 | 1.29% 9,894 |
| 1980 | 60.81% 435,910 | 27.26% 195,410 | 11.93% 85,546 |
| 1976 | 55.74% 353,302 | 41.60% 263,654 | 2.66% 16,839 |
| 1972 | 61.82% 371,627 | 34.34% 206,455 | 3.84% 23,055 |
| 1968 | 56.26% 261,540 | 36.07% 167,669 | 7.67% 35,654 |
| 1964 | 50.31% 214,445 | 49.69% 211,808 | 0.01% 33 |
| 1960 | 56.41% 223,056 | 43.31% 171,259 | 0.28% 1,106 |
| 1956 | 64.47% 195,742 | 35.15% 106,716 | 0.38% 1,147 |
| 1952 | 63.50% 186,091 | 35.92% 105,255 | 0.58% 1,688 |
| 1948 | 49.43% 101,552 | 47.80% 98,217 | 2.77% 5,690 |
| 1944 | 45.42% 75,746 | 53.94% 89,959 | 0.64% 1,059 |
| 1940 | 43.27% 55,434 | 55.57% 71,188 | 1.16% 1,488 |
| 1936 | 35.04% 35,686 | 63.45% 64,628 | 1.51% 1,540 |
| 1932 | 41.46% 35,305 | 53.58% 45,622 | 4.96% 4,223 |
| 1928 | 67.14% 47,769 | 31.97% 22,749 | 0.89% 633 |
| 1924 | 48.99% 22,726 | 6.35% 2,944 | 44.66% 20,721 |
| 1920 | 63.78% 19,826 | 27.27% 8,478 | 8.95% 2,783 |
| 1916 | 46.47% 16,978 | 46.02% 16,815 | 7.51% 2,744 |
| 1912 | 0.29% 63 | 44.79% 9,731 | 54.92% 11,934[55] |
| 1908 | 57.56% 5,412 | 25.45% 2,393 | 16.99% 1,598 |
| 1904 | 59.52% 4,303 | 19.34% 1,398 | 21.15% 1,529 |
| 1900 | 54.91% 3,800 | 38.69% 2,678 | 6.40% 443 |
| 1896 | 46.86% 3,631 | 50.44% 3,908 | 2.70% 209 |
| 1892 | 45.71% 3,525 | 30.26% 2,334 | 24.03% 1,853 |
| 1888 | 56.88% 4,661 | 38.92% 3,189 | 4.20% 344 |
| 1884 | 57.00% 1,120 | 40.71% 800 | 2.29% 45 |
| 1880 | 56.80% 743 | 41.74% 546 | 1.45% 19 |
Federal and state representation
In the U.S. House of Representatives, San Diego County is split between five congressional districts:[56]
- California's 49 congressional district, represented by قالب:Representative/format/pfl
- California's 50 congressional district, represented by قالب:Representative/format/pfl
- California's 51st congressional district, represented by قالب:Representative/format/pfl
- California's 52nd congressional district, represented by قالب:Representative/format/pfl and
- California's 53rd congressional district, represented by قالب:Representative/format/pfl.
In the California State Assembly, San Diego County is split between seven legislative districts:[57]
- the 71st Assembly District, represented by Republican Brian Jones,
- the 75 Assembly District, represented by Republican Marie Waldron,
- the 76 Assembly District, represented by Republican Rocky Chavez,
- the 77 Assembly District, represented by Republican Brian Maienschein,
- the 78 Assembly District, represented by Democrat Toni Atkins,
- the 79 Assembly District, represented by Democrat Shirley Weber, and
- the 80 Assembly District, represented by Democrat Lorena Gonzalez.
In the California State Senate, San Diego County is split between four legislative districts:[58]
- the 36 Senate District, represented by Republican Patricia Bates,
- the 38 Senate District, represented by Republican Joel Anderson,
- the 39 Senate District, represented by Democrat Marty Block, and
- the 40 Senate District, represented by Democrat Ben Hueso.
Crime
The following table includes the number of incidents reported and the rate per 1,000 persons for each type of offense.
| Population and crime rates | ||
|---|---|---|
| Population[23] | 3,060,849 | |
| Violent crime[59] | 12,775 | 4.17 |
| Homicide[59] | 75 | 0.02 |
| Forcible rape[59] | 746 | 0.24 |
| Robbery[59] | 4,033 | 1.32 |
| Aggravated assault[59] | 7,921 | 2.59 |
| Property crime[59] | 43,525 | 14.22 |
| Burglary[59] | 14,522 | 4.74 |
| Larceny-theft[59][note 2] | 41,278 | 13.49 |
| Motor vehicle theft[59] | 13,938 | 4.55 |
| Arson[59] | 394 | 0.13 |
Cities by population and crime rates
| Cities by population and crime rates | ||||||||
|---|---|---|---|---|---|---|---|---|
| City | Population[60] | Violent crimes[60] | Violent crime rate per 1,000 persons |
Property crimes[60] | Property crime rate per 1,000 persons | |||
| Carlsbad | 107,879 | 265 | 2.46 | 2,109 | 19.55 | |||
| Chula Vista | 249,830 | 581 | 2.33 | 5,081 | 20.34 | |||
| Coronado | 19,345 | 20 | 1.03 | 504 | 26.05 | |||
| Del Mar | 4,263 | 15 | 3.52 | 211 | 49.50 | |||
| El Cajon | 101,864 | 365 | 3.58 | 2,414 | 23.70 | |||
| Encinitas | 60,960 | 150 | 2.46 | 1,296 | 21.26 | |||
| Escondido | 147,386 | 628 | 4.26 | 3,887 | 26.37 | |||
| Imperial Beach | 26,956 | 147 | 5.45 | 471 | 17.47 | |||
| La Mesa | 58,444 | 224 | 3.83 | 1,732 | 29.64 | |||
| Lemon Grove | 25,932 | 137 | 5.28 | 434 | 16.74 | |||
| National City | 59,920 | 371 | 6.19 | 1,863 | 31.09 | |||
| Oceanside | 171,141 | 728 | 4.25 | 4,289 | 25.06 | |||
| Poway | 48,968 | 94 | 1.92 | 559 | 11.42 | |||
| San Diego | 1,338,477 | 5,529 | 4.13 | 31,700 | 23.68 | |||
| San Marcos | 85,810 | 227 | 2.65 | 1,502 | 17.50 | |||
| Santee | 54,700 | 154 | 2.82 | 1,109 | 20.27 | |||
| Solana Beach | 13,181 | 24 | 1.82 | 313 | 23.75 | |||
| Vista | 96,087 | 465 | 4.84 | 1,885 | 19.62 | |||
Education
San Diego County contains three public state universities: University of California, San Diego; San Diego State University; and California State University, San Marcos. Major private universities in the county include University of San Diego (USD), Point Loma Nazarene University (PLNU), Alliant International University (AIU), and National University. It also includes three law schools, USD School of Law, California Western School of Law, and Thomas Jefferson School of Law.
Within the county there are 24 public elementary school districts, 6 high school districts, and 12 unified school districts. There are also 5 community college districts.[61]
There are two separate public library systems in San Diego County: the San Diego Public Library serving the city of San Diego, and the San Diego County Library serving all other areas of the county. In 2010 the county library had 33 branches and two bookmobiles; circulated over 10.7 million books, CDs, DVDs, and other material formats; recorded 5.7 million visits to library branches; and hosted 21,132 free programs and events. The San Diego County Library is one of the 25 busiest libraries in the nation as measured by materials circulated.[62][63]
Community College Districts
- Grossmont-Cuyamaca Community College District
- MiraCosta Community College District
- Palomar Community College District
- San Diego Community College District
- Southwestern Community College District
Military
_returning_to_San_Diego_040309-N-7949W-002.jpg&filetimestamp=20201030202059&)
San Diego is the headquarters of the U.S. Navy's Eleventh Naval District and is the Navy's principal location for West Coast and Pacific Ocean operations.[64] Naval Base San Diego, California is principal home to the Pacific Fleet (although the headquarters is located in Pearl Harbor). NAS North Island is located on the north side of Coronado, and is home to Headquarters for Naval Air Forces and Naval Air Force Pacific, the bulk of the Pacific Fleet's helicopter squadrons, and part of the West Coast aircraft carrier fleet.
The Naval Special Warfare Center is the primary training center for SEALs, and is also located on Coronado. The area contains five major naval bases and the U.S. Marines base Camp Pendleton. Marine Corps Base Camp Pendleton is the major West Coast base of the United States Marine Corps and serves as its prime amphibious training base.[65] It is located on the Southern California coast, bordered by Oceanside to the south, San Clemente to the north, and Fallbrook to the east.
- Naval Base San Diego, also known as 32nd Street Naval Station
- Naval Amphibious Base Coronado
- Naval Air Station North Island
- Naval Base Point Loma, which includes the Submarine Base and the Fleet Antisubmarine Warfare Training Center
- Space and Naval Warfare Systems Command (SPAWAR)
- Naval Medical Center San Diego, also known as Bob Wilson Naval Hospital and Balboa Naval Hospital
U.S. Marine Corps
- Marine Corps Base Camp Pendleton
- Marine Corps Air Station Miramar
- Marine Corps Recruit Depot San Diego
U.S. Coast Guard
Media
San Diego County is primarily served by media in San Diego, including TV and radio stations based in the city.
Light rail and local transit
- San Diego Trolley
- San Diego Metropolitan Transit System (SDMTS/MTS)
- Sprinter
- North County Transit District (NCTD)
The Port of San Diego
Airports
- San Diego International Airport (Lindbergh Field) (SAN)
- Montgomery Field (MYF)
- McClellan-Palomar Airport (CRQ) a.k.a. Palomar Airport or Carlsbad Airport
- Gillespie Field (SEE)
- Agua Caliente Airport (L54)
- Borrego Valley Airport (L08)
- Fallbrook Community Airpark (L18)
- Oceanside Municipal Airport (K0KB)
- Ocotillo Airport (L90)
- Ramona Airport (RNM)
- Brown Field Municipal Airport (SDM) (formerly East Field, NAAS Otay Mesa, and NAAS Brown Field)
Communities


Cities
| City | Year
incorporated |
Population
(2018 estimate)[66] |
|---|---|---|
| Carlsbad | 1952 | 115,877
|
| Chula Vista | 1911 | 271,651
|
| Coronado | 1890 | 21,390
|
| Del Mar | 1959 | 4,347
|
| El Cajon | 1912 | 103,241
|
| Encinitas | 1986 | 62,904
|
| Escondido | 1888 | 152,213
|
| Imperial Beach | 1956 | 27,447
|
| La Mesa | 1912 | 59,556
|
| Lemon Grove | 1977 | 26,969
|
| National City | 1887 | 61,431
|
| Oceanside | 1888 | 176,080
|
| Poway | 1980 | 49,704
|
| San Diego (county seat) | 1850 | 1,425,976
|
| San Marcos | 1963 | 96,847
|
| Santee | 1980 | 58,115
|
| Solana Beach | 1986 | 13,379
|
| Vista | 1963 | 101,224
|
Former cities
| City | Year
incorporated |
Year
dissolved |
Fate |
|---|---|---|---|
| East San Diego | 1912 | 1923 | Merged into San Diego |
Census-designated places
- Alpine
- Bonita
- Bonsall
- Borrego Springs
- Bostonia
- Boulevard
- Campo
- Camp Pendleton North
- Camp Pendleton South
- Casa de Oro-Mount Helix
- Crest
- Descanso
- Eucalyptus Hills
- Fairbanks Ranch
- Fallbrook
- Granite Hills
- Harbison Canyon
- Hidden Meadows
- Jacumba Hot Springs
- Jamul
- Julian
- Lake San Marcos
- Lakeside
- La Presa
- Mount Laguna
- Oak Grove
- Pala
- Pine Valley
- Potrero
- Rainbow
- Ramona
- Rancho San Diego
- Rancho Santa Fe
- San Diego Country Estates
- Spring Valley
- Valley Center
- Winter Gardens
Unincorporated communities
- 4S Ranch
- Agra
- Alpine Heights
- Ballena
- Bankhead Springs
- Banner
- Barona
- Barrett
- Barrett Junction
- Blossom Valley
- Borrego
- Boulder Oaks
- Boulder Oaks
- Buena
- Calavo Gardens
- Calexico Lodge
- Cameron Corners
- Canyon City
- Casa de Oro
- Chappo
- Clover Flat
- Dehesa
- Del Dios
- Deluz
- De Luz
- De Luz Heights
- Descanso Junction
- Desert Lodge
- Doghouse Junction
- Dos Cabezas
- Dulzura
- Eagles Nest
- East Otay Mesa
- Elfin Forest
- Engineer Springs
- Fallbrook Junction
- Fernbrook
- Flinn Springs
- Foster
- Four Corners
- Glen Oaks
- Glenview
- Grossmont
- Guatay
- Hacienda del Florasol
- Harmony Grove
- Harrison Park
- Holcomb Village
- Homelands
- Hulburd Grove
- Indian Springs
- Irvings Crest
- Jamacha
- Jamacha Junction
- Jesmond Dene
- Jofegan
- Johnstown
- Kentwood-In-The-Pines
- La Cresta
- Laguna Junction
- La Jolla Amigo
- Lakeside Farms
- Lakeview
- Las Flores
- Lilac
- Lincoln Acres
- Live Oak Springs
- Los Terrenitos
- Los Tules
- Lynwood Hills
- Manzanita
- Mesa Grande
- Mesquite Oasis
- Morena Village
- Moreno
- Morettis Junction
- Mortero Palms
- Mount Helix
- North Jamul
- Ocotillo Wells
- Pala Mesa
- Palm Grove
- Palomar Mountain
- Pauma Valley
- Phelps Corner
- Pine Grove
- Pine Hills
- Ranchita
- Rancho del Campo
- Ridgecrest Estates
- Rincon
- Riverview
- Riverview Farms
- Rosemont
- San Felipe
- San Ignacio
- San Luis Rey Heights
- San Onofre
- Santa Ysabel
- Scissors Crossing
- Shady Dell
- Shelter Valley
- Stallion Oaks
- Stuart
- Suncrest
- Sunnyside
- Tecate
- The Willows
- Tierra del Sol
- Titus
- Warner Springs
- Winterwarm
- Whispering Pines
- Wynola
- Yaldora
Indian reservations
San Diego County has 18 federally recognized Indian reservations, more than any other county in the United States.[67] Although they are typical in size to other Indian reservations in California (many of which are termed "Rancherías"), they are relatively tiny by national standards,[بحاجة لمصدر] and all together total 200.2 sq mi (519 km2) of area.
- Barona Indian Reservation
- Campo Indian Reservation
- Capitan Grande Reservation
- Ewiiaapaayp Indian Reservation
- Inaja and Cosmit Indian Reservation
- Jamul Indian Village
- La Jolla Indian Reservation
- La Posta Indian Reservation
- Los Coyotes Indian Reservation
- Manzanita Indian Reservation
- Mesa Grande Indian Reservation
- Pala Indian Reservation
- Pauma and Yuima Indian Reservation
- Rincon Indian Reservation
- San Pasqual Indian Reservation
- Santa Ysabel Indian Reservation
- Sycuan Indian Reservation
- Viejas Indian Reservation
Population ranking
The population ranking of the following table is based on the 2010 census of San Diego County.[68]
† county seat
| Rank | City/Town/etc. | Municipal type | Population (2010 Census) |
|---|---|---|---|
| 1 | † San Diego | City | 1,307,402 |
| 2 | Chula Vista | City | 243,916 |
| 3 | Oceanside | City | 167,086 |
| 4 | Escondido | City | 143,911 |
| 5 | Carlsbad | City | 105,328 |
| 6 | El Cajon | City | 99,478 |
| 7 | Vista | City | 93,834 |
| 8 | San Marcos | City | 83,781 |
| 9 | Encinitas | City | 59,518 |
| 10 | National City | City | 58,582 |
| 11 | La Mesa | City | 57,065 |
| 12 | Santee | City | 53,413 |
| 13 | Poway | City | 47,811 |
| 14 | La Presa | CDP | 34,169 |
| 15 | Fallbrook | CDP | 30,534 |
| 16 | Spring Valley | CDP | 28,205 |
| 17 | Imperial Beach | City | 26,324 |
| 18 | Lemon Grove | City | 25,320 |
| 19 | Rancho San Diego | CDP | 21,208 |
| 20 | Lakeside | CDP | 20,648 |
| 21 | Winter Gardens | CDP | 20,631 |
| 22 | Ramona | CDP | 20,292 |
| 23 | Coronado | City | 18,912 |
| 24 | Casa de Oro-Mount Helix | CDP | 18,762 |
| 25 | Bostonia | CDP | 15,379 |
| 26 | Alpine | CDP | 14,236 |
| 27 | Solana Beach | City | 12,867 |
| 28 | Bonita | CDP | 12,538 |
| 29 | Camp Pendleton South | CDP | 10,616 |
| 30 | San Diego Country Estates | CDP | 10,109 |
| 31 | Valley Center | CDP | 9,277 |
| 32 | Jamul | CDP | 6,163 |
| 33 | Eucalyptus Hills | CDP | 5,313 |
| 34 | Camp Pendleton North | CDP | 5,200 |
| 35 | Lake San Marcos | CDP | 4,437 |
| 36 | Del Mar | City | 4,161 |
| 37 | Bonsall | CDP | 3,982 |
| 38 | Harbison Canyon | CDP | 3,841 |
| 39 | Hidden Meadows | CDP | 3,485 |
| 40 | Borrego Springs | CDP | 3,429 |
| 41 | Fairbanks Ranch | CDP | 3,148 |
| 42 | Rancho Santa Fe | CDP | 3,117 |
| 43 | Granite Hills | CDP | 3,035 |
| 44 | Campo | CDP | 2,684 |
| 45 | Crest | CDP | 2,593 |
| 46 | Rainbow | CDP | 1,832 |
| 47 | Pine Valley | CDP | 1,510 |
| 48 | Julian | CDP | 1,502 |
| 49 | Descanso | CDP | 1,423 |
| 50 | Pala Indian Reservation[69] | AIAN | 1,315 |
| 51 | Rincon Reservation[70] | AIAN | 1,215 |
| 52 | San Pasqual Reservation[71] | AIAN | 1,097 |
| 53 | Potrero | CDP | 656 |
| 54 | Barona Reservation[72] | AIAN | 640 |
| 55 | Jucumba Hot Springs | CDP | 561 |
| 56 | Viejas Reservation[73] | AIAN | 520 |
| 57 | La Jolla Reservation[74] | AIAN | 476 |
| 58 | Campo Indian Reservation[75] | AIAN | 362 |
| 59 | Santa Ysabel Reservation[76] | AIAN | 330 |
| 60 | Boulevard | CDP | 315 |
| 61 | Sycuan Reservation[77] | AIAN | 211 |
| 62 | Pauma and Yuima Reservation[78] | AIAN | 206 |
| t-63 | Los Coyotes Reservation[79] | AIAN | 98 |
| t-63 | Mesa Grande Reservation[80] | AIAN | 98 |
| 64 | Manzanita Reservation[81] | AIAN | 78 |
| 65 | Mount Laguna | CDP | 57 |
| 66 | La Posta Indian Reservation[82] | AIAN | 55 |
See also
- List of breweries in San Diego County, California
- List of high schools in San Diego County, California
- List of museums in San Diego County, California
- List of school districts in San Diego County, California
- List of United States counties and county-equivalents
- National Register of Historic Places listings in San Diego County, California
- San Diego Association of Governments (SANDAG)
Notes
References
- ^ "Chronology". California State Association of Counties. Retrieved February 6, 2015.
- ^ "Chief Administrative Officer". County of San Diego. Retrieved January 31, 2015.
- ^ "Board of Supervisors". County of San Diego. Retrieved January 12, 2015.
- ^ "Hot Springs Mountain". Peakbagger.com. Retrieved January 31, 2015.
- ^ أ ب ت "State & County QuickFacts". United States Census Bureau. Retrieved April 6, 2016.
- ^ أ ب "American FactFinder". Archived from the original on February 14, 2020. Retrieved April 19, 2019.
- ^ "GDP by County - U.S. Bureau of Economic Analysis (BEA)". Bea.gov. Retrieved December 12, 2019.
- ^ "Find a County". National Association of Counties. Retrieved June 7, 2011.
- ^ "OMB Bulletin No. 13-01: Revised Delineations of Metropolitan Statistical Areas, Micropolitan Statistical Areas, and Combined Statistical Areas, and Guidance on Uses of the Delineations of These Areas" (PDF). United States Office of Management and Budget. February 28, 2013. Archived from the original (PDF) on March 19, 2013. Retrieved March 20, 2013.
- ^ "Table 1. Annual Estimates of the Population of Metropolitan and Micropolitan Statistical Areas: April 1, 2010 to July 1, 2012". 2012 Population Estimates. United States Census Bureau, Population Division. March 2013. Archived from the original (CSV) on April 1, 2013. Retrieved March 20, 2013.
- ^ "Table 2. Annual Estimates of the Population of Combined Statistical Areas: April 1, 2010 to July 1, 2012". 2012 Population Estimates. United States Census Bureau, Population Division. March 2013. Archived from the original (CSV) on May 17, 2013. Retrieved March 20, 2013.
- ^ "climate map". Koeppen-geirger.vu.
- ^ "KUMEYAAY RESEARCH DEPARTMENT USA American San Diego County Indian Reservations Tribes of Baja California Mexico Culture". Kumeyaay.info.
- ^ "San Diego Historical Society". Sandiegohistory.org.
- ^ "Journal of San Diego History, October 1967". Sandiegohistory.org.
- ^ "San Diego de Alcalá - California Missions Resource Center". Missionscalifornia.com. Archived from the original on June 10, 2010. Retrieved April 18, 2013.
- ^ Coy, Owen C.; PhD (1923). California County Boundaries. Berkeley: California Historical Commission. ASIN B000GRBCXG.
{{cite book}}: CS1 maint: multiple names: authors list (link) - ^ "2010 Census Gazetteer Files". United States Census Bureau. August 22, 2012. Retrieved October 4, 2015.
- ^ "wild san diego county". April 17, 2002. Archived from the original on April 17, 2002. Retrieved February 17, 2019.
- ^ M. Kottek; J. Grieser; C. Beck; B. Rudolf; F. Rubel (2006). "World Map of the Köppen-Geiger climate classification updated". Meteorol. Z. 15: 259–263. doi:10.1127/0941-2948/2006/0130. Retrieved April 22, 2009.
- ^ Jennewein, Chris (26 March 2015). "San Diego Nation's 5th Most Populous County in 2014". Times of San Diego. Retrieved 22 March 2018.
Mendelson, Aaron (26 March 2015). "LA County is nation's most populous — still". KPCC. Pasadena, California. - ^ "San Diego County Commute" (PDF). Calmis.ca.gov.
- ^ أ ب ت ث ج ح خ د ذ ر U.S. Census Bureau. American Community Survey, 2011 American Community Survey 5-Year Estimates, Table B02001. U.S. Census website. Retrieved October 26, 2013.
- ^ U.S. Census Bureau. American Community Survey, 2011 American Community Survey 5-Year Estimates, Table B03003. U.S. Census website. Retrieved October 26, 2013.
- ^ U.S. Census Bureau. American Community Survey, 2011 American Community Survey 5-Year Estimates, Table B19301. U.S. Census website. Retrieved October 21, 2013.
- ^ U.S. Census Bureau. American Community Survey, 2011 American Community Survey 5-Year Estimates, Table B19013. U.S. Census website. Retrieved October 21, 2013.
- ^ U.S. Census Bureau. American Community Survey, 2011 American Community Survey 5-Year Estimates, Table B19113. U.S. Census website. Retrieved October 21, 2013.
- ^ "U.S. Decennial Census". United States Census Bureau. Retrieved October 4, 2015.
- ^ "Historical Census Browser". University of Virginia Library. Retrieved October 4, 2015.
- ^ Forstall, Richard L., ed. (March 27, 1995). "Population of Counties by Decennial Census: 1900 to 1990". United States Census Bureau. Retrieved October 4, 2015.
- ^ "Census 2000 PHC-T-4. Ranking Tables for Counties: 1990 and 2000" (PDF). United States Census Bureau. April 2, 2001. Retrieved October 4, 2015.
- ^ قالب:USCensus2010CA
- ^ "Profile of General Population and Housing Characteristics: 2010". American Fact Finder. United States Census Bureau. 2010. Archived from the original on February 14, 2020. Retrieved April 10, 2018.
- ^ Sheldon X. Zhang; Karen J. Bachar; John Picarelli; Yang Qin; Irma Cordova; Manuel Enrique; Cristina Juarez; Adan Ortiz; et al. (November 2012). Looking for a Hidden Population: Trafficking of Migrant Laborers in San Diego County. San Diego State University. pp. 16–17. Archived from the original. You must specify the date the archive was made using the
|archivedate=parameter. https://www.ncjrs.gov/pdffiles1/nij/grants/240223.pdf. Retrieved on September 12, 2018. - ^ Stebbins, Samuel (August 15, 2018). "Priced out of the market? Cities where the middle class can no longer afford a home". USA Today. 24/7 Wall Street. Retrieved 15 August 2018.
- ^ Molnar, Phillip (September 26, 2018). "New record: San Diego home price hits $583K". San Diego Union-Tribune. Retrieved October 4, 2018.
- ^ U.S. Census Bureau. American Community Survey, 2011 American Community Survey 5-Year Estimates, Tables B01003 and B19025. U.S. Census website. Retrieved October 26, 2013.
- ^ https://www.rtfhsd.org/wp-content/uploads/2017/06/2018-WPoint-in-Time-Count-Annual-Report.pdf. San Diego Regional Task Force on the Homeless. Retrieved March 4, 2020.
- ^ "Adults in the San Diego metro area". Religious Landscape Study. Per Research Center. 2014. Retrieved 10 May 2018.
- ^ "San Diego County". Center for Religion and Civic Culture. University of Southern California. September 17, 2009. Retrieved May 10, 2018.
- ^ "Social Capital Variables Spreadsheet for 2014". PennState College of Agricultural Sciences, Northeast Regional Center for Rural Development. December 8, 2017. Retrieved December 30, 2019.
- ^ Stewart, Joshua (9 February 2017). "San Diego home to 170k immigrants here illegally, study shows". San Diego Union-Tribune. Retrieved 15 May 2018.
- ^ Carpenter, Ami; Gates, Jamie (April 2016). The Nature and Extent of Gang Involvement in Sex Trafficking in San Diego County. United States Department of Justice. p. 14. Archived from the original. You must specify the date the archive was made using the
|archivedate=parameter. https://www.ncjrs.gov/pdffiles1/nij/grants/249857.pdf. Retrieved on 15 May 2018. - ^ Marosi, Richard (May 14, 2018). "The aggressive prosecution of border-crossers is straining the courts. Will 'zero tolerance' make it worse?". Richmond Times-Dispatch. Los Angeles Times. Retrieved May 15, 2018.
- ^ [1][dead link]
- ^ "Report: Wages don't cover high cost of living for 33% of San Diegans". KSWB-TV. San Diego. City News Service. 31 January 2017. Retrieved 4 May 2018.
Jones, Tom; Campbell, Ron (30 March 2018). "MAP: Housing Costs Continue to Outpace Incomes in San Diego County". KNSD. San Diego. Retrieved 4 May 2018.
"San Diego, California". U.S. News & World Report. 2017. Retrieved 4 May 2018.
Freeman, Mike (12 April 2018). "Survey: San Diego is a good place for job hunters, but pay lags living costs". San Diego Union-Tribune. Retrieved 4 May 2018.
Self, Zac (26 March 2018). "Data shows how much San Diego families need to budget". KGTV. San Diego. Retrieved 4 May 2018.
Bauder, Don (21 February 2018). "Good weather, high cost of living make San Diego bad for pro sports". San Diego Reader. Retrieved 4 May 2018. - ^ Rivard, Ry (30 May 2017). "Why San Diego Pays Some of Highest Water Rates in State and Country". News Deeply. New York. Voice of San Diego. Retrieved 4 May 2018.
- ^ Stafford, Audra (19 January 2018). "San Diegans Coping with Rising Rental Costs". KNSD. San Diego. Retrieved 20 March 2018.
Cavanaugh, Maureen; Lipkin, Michael (9 October 2017). "Average Rent Hit Record High In San Diego County". KPBS. San Diego. Retrieved 20 March 2018.
Molnar, Phillip (5 October 2017). "San Diego County rents hit record high". San Diego Union-Tribune. Retrieved 20 March 2018.
Daniels, Jeff (19 March 2018). "Californians fed up with housing costs and taxes are fleeing state in big numbers". CNBC. New Jersey. Retrieved 20 March 2018. - ^ Kotkin, Joel; Cox, Wendell (24 April 2017). "Leaving California? After slowing, the trend intensifies". Mercury News. Santa Clara. Retrieved 20 March 2018.
Collins, Jeff (30 May 2017). "Why some people are fleeing Southern California". Orange County Register. Retrieved 20 March 2018.
Levy, Alon (17 April 2017). "Low-Income San Diegans Are Getting Pushed to Riverside". Voice of San Diego. Retrieved 20 March 2018.
Molnar, Phillip (21 September 2017). "Would you leave San Diego because of housing costs?". San Diego Union-Tribune. Retrieved 20 March 2018.
Bauder, Don (9 April 2014). "Why more people leave than enter San Diego". San Diego Reader. Retrieved 20 March 2018. - ^ California Government Code § 23004
- ^ "About County Government". Guide to Government. League of Women Voters of California. Retrieved December 26, 2012.
- ^ أ ب "Report of Registration - State Reporting Districts" (PDF). sdvote.com. County of San Diego. سبتمبر 6, 2014. Archived from the original (PDF) on مايو 1, 2015. Retrieved سبتمبر 19, 2014.
- ^ https://elections.cdn.sos.ca.gov/ror/ror-odd-year-2019/politicalsub.pdf
- ^ Leip, David. "Dave Leip's Atlas of U.S. Presidential Elections". uselectionatlas.org.
- ^ The leading "other" candidate, Progressive Theodore Roosevelt, received 7,922 votes, while Socialist candidate Eugene Debs received 2,873 votes and Prohibition candidate Eugene Chafin received 1,139 votes.
- ^ "Counties by County and by District". California Citizens Redistricting Commission. Archived from the original on سبتمبر 30, 2013. Retrieved سبتمبر 24, 2014.
- ^ "Communities of Interest — County". California Citizens Redistricting Commission. Archived from the original on أكتوبر 23, 2015. Retrieved سبتمبر 28, 2014.
- ^ "Communities of Interest — County". California Citizens Redistricting Commission. Archived from the original on أكتوبر 23, 2015. Retrieved سبتمبر 28, 2014.
- ^ أ ب ت ث ج ح خ د ذ ر Office of the Attorney General, Department of Justice, State of California. Table 11: Crimes – 2009 Archived ديسمبر 2, 2013 at the Wayback Machine. Retrieved November 14, 2013.
- ^ أ ب ت United States Department of Justice, Federal Bureau of Investigation. Crime in the United States, 2012, Table 8 (California). Retrieved November 14, 2013.
- ^ "San Diego County Board of Education". Web.archive.org. Archived from the original on مارس 26, 2012. Retrieved مارس 26, 2011.
- ^ County of San Diego: San Diego County Library. Sdcl.org (2007-09-30). Retrieved on 2014-05-24.
- ^ San Diego County Library: Annual Report FY 2009-2010. Dbpcosdcsgt.co.san-diego.ca.us (2009-09-21). Retrieved on 2014-05-24.
- ^ "San Diego Economy". CityData.com.
{{cite web}}: Cite has empty unknown parameter:|month=(help) - ^ Estes, Kenneth W. (1999). The Marine Officer's Guide – Sixth Edition. Annapolis, Maryland: Naval Institute Press. p. 176. ISBN 1-55750-567-5.
- ^ Bureau, U. S. Census. "U.S. Census website". United States Census Bureau (in الإنجليزية). Retrieved 2019-08-04.
- ^ "University of San Diego". Sandiego.edu. Archived from the original on يناير 25, 2010.
- ^ "2010 U.S. Census website". United States Census Bureau. Retrieved July 10, 2016.
- ^ "2010 Census Interactive Population Search : Pala Indian Reservation". Census.gov. Archived from the original on يوليو 19, 2018. Retrieved نوفمبر 7, 2017.
- ^ "2010 Census Interactive Population Search : Rincon Reservation". Census.gov. Archived from the original on يوليو 19, 2018. Retrieved نوفمبر 7, 2017.
- ^ "2010 Census Interactive Population Search : San Pasqual Reservation". Census.gov. Archived from the original on يوليو 19, 2018. Retrieved نوفمبر 7, 2017.
- ^ "2010 Census Interactive Population Search : Barona Reservation". Census.gov. Archived from the original on يوليو 19, 2018. Retrieved نوفمبر 7, 2017.
- ^ "2010 Census Interactive Population Search : Viejas Reservation". Census.gov. Archived from the original on يوليو 19, 2018. Retrieved نوفمبر 7, 2017.
- ^ "2010 Census Interactive Population Search : La Jolla Reservation". Census.gov. Archived from the original on يوليو 19, 2018. Retrieved نوفمبر 7, 2017.
- ^ "2010 Census Interactive Population Search : Campo Indian Reservation". Census.gov. Archived from the original on يوليو 19, 2018. Retrieved نوفمبر 7, 2017.
- ^ "2010 Census Interactive Population Search : Santa Ysabel Reservation". Census.gov. Archived from the original on يوليو 19, 2018. Retrieved نوفمبر 7, 2017.
- ^ "2010 Census Interactive Population Search : Sycuan Reservation". Census.gov. Archived from the original on يوليو 19, 2018. Retrieved نوفمبر 7, 2017.
- ^ "2010 Census Interactive Population Search : Pauma and Yuima Reservation". Census.gov. Archived from the original on يوليو 19, 2018. Retrieved نوفمبر 7, 2017.
- ^ "2010 Census Interactive Population Search : Los Coyotes Reservation". Census.gov. Archived from the original on يوليو 19, 2018. Retrieved نوفمبر 7, 2017.
- ^ "2010 Census Interactive Population Search : Mesa Grande Reservation". Census.gov. Archived from the original on يوليو 19, 2018. Retrieved نوفمبر 7, 2017.
- ^ "2010 Census Interactive Population Search : Manzanita Reservation". Census.gov. Archived from the original on يوليو 19, 2018. Retrieved نوفمبر 7, 2017.
- ^ "2010 Census Interactive Population Search : La Posta Indian Reservation". Census.gov. Archived from the original on يوليو 19, 2018. Retrieved نوفمبر 7, 2017.
Further reading
- Pryde, Philip R. San Diego: An Introduction to the Region (4th ed. 2004), a historical geography
External links
- Official website

- San Diego Association of Governments (SANDAG) official website
- San Diego Tourism Authority
- San Diego Geographic Information Source
أماكن قريبة من مقاطعة سان دييغو، كاليفورنيا | |
|---|---|
بلديات ومجتمعات مقاطعة سان دييگو، كاليفورنيا، الولايات المتحدة | ||
|---|---|---|
| المدن | Carlsbad |
Chula Vista | Coronado | دلمار | El Cajon | Encinitas | Escondido | Imperial Beach | La Mesa | Lemon Grove | National City | Oceanside | Poway | سان دييگو | San Marcos | Santee | Solana Beach | Vista |  |
| CDPs | Alpine |
Bonita | Bonsall | Borrego Springs | Bostonia | Camp Pendleton North | Camp Pendleton South | Casa de Oro-Mount Helix | Crest | Fairbanks Ranch | Fallbrook | Granite Hills | Harbison Canyon | Hidden Meadows | Jamul | Julian | La Presa | Lake San Marcos | Lakeside | Pine Valley | Rainbow | Ramona | Rancho San Diego | Rancho Santa Fe | San Diego Country Estates | Spring Valley | Valley Center | Winter Gardens | |
| Unincorporated communities | 4S Ranch |
Boulevard | Campo | Descanso | Dulzura | Guatay | Jacumba | Jesmond Dene | Lincoln Acres | Mount Laguna | Ocotillo Wells | Pala | Potrero | Santa Ysabel | Tecate | |
| المقاطعات | ||
|---|---|---|
| المدن الكبرى | ||
| مدن 100+k | ||
| مدن 20k–99k | ||
| مدن أقل من 20k | ||
| م.م.إ. 20k+ | ||
| مسطحات مائية | ||
| المناطق | ||
| المنتزهات والنصب التذكارية | ||
| المقاطعات والبلديات | 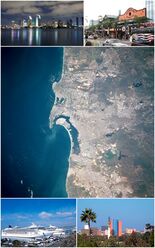 | |
|---|---|---|
| المدن الرئيسية | ||
| مدن 100k–250k | ||
| مدن وبلدات 20k–99k | ||
| مدن وبلدات 10k–19k | ||
| المسطحات المائية | ||
| المناطق الفرعية | ||

_returning_to_San_Diego_040309-N-7949W-002.jpg&filetimestamp=20201030202059)
- Pages using gadget WikiMiniAtlas
- Articles with dead external links from May 2018
- Short description is different from Wikidata
- Coordinates on Wikidata
- Articles containing إنگليزية-language text
- Pages using Lang-xx templates
- Articles with hatnote templates targeting a nonexistent page
- Pages using US Census population needing update
- مقالات فيها عبارات متقادمة منذ 2014
- جميع المقالات التي فيها عبارات متقادمة
- مقالات فيها عبارات متقادمة منذ 2018
- Articles with unsourced statements from January 2010
- Pages with empty portal template
- Portal-inline template with redlinked portals
- San Diego County, California
- 1850 establishments in California
- California counties
- Counties in Southern California
- Geography of San Diego County, California
- Metropolitan areas of California
- Populated places established in 1850
- San Diego metropolitan area