الطاقة في الولايات المتحدة

Energy in the United States is obtained from a diverse portfolio of sources, although the majority came from fossil fuels in 2021, as 36% of the nation's energy originated from petroleum, 32% from natural gas, and 11% from coal. Electricity from nuclear power supplied 8% and renewable energy supplied 12%, which includes biomass, wind, hydro, solar and geothermal.[1]
Energy figures are measured in BTU, with 1 BTU equal to 1.055 kJ and 1 quadrillion BTU (1 quad) equal to 1.055 EJ. Because BTU is a unit of heat, sources that generate electricity directly are multiplied by a conversion factor to equate them with sources that use a heat engine.[2]
The United States was the second-largest energy producer and consumer in 2021 after China.[3] The country had a per capita energy consumption of 295 million BTU (311 GJ), ranking it tenth in the world behind Canada, Norway, and several Arabian nations.[3] Consumption was mostly for industry (33%) and transportion (28%), with use in homes (21%) and commercial buildings (18%) making up the remainder.[4][5]
The United States' portion of the electrical grid in North America had a nameplate capacity of 1,213 GW and produced 3,988 TWh in 2021, using 37% of primary energy to do so.[6][7] The country is the second-largest producer and consumer of electricity, behind China.[3] Natural gas overtook coal as the dominant source for electric generation in 2016. While coal use has been dropping, it remained larger than either nuclear or renewables.[6]
التاريخ


From its founding until the late 19th century, population and energy use in the United States both increased by about 3% per year,[8][9] resulting in a relatively constant per capita energy use of 100 million BTU. Wood made up the majority of this until near the end of the 1800s, meaning the average American burned eight tons of wood each year.[10]
The Industrial Revolution in the United States saw an increased use of coal. By the late 1800s, it surpassed wood as the major source of energy, as it was cheaper for those living in cities. Lighting, heating and transportation could all be fueled by coal.[11] Between 1925 and 1975, coal use was more stagnant, although it dominated the growing electricity sector.[12] Petroleum and natural gas took its place, as car ownership doubled in the two decades after the war,[13] and as the number of pipelines rose dramatically.[14]
During the first half of the 20th century, per capita energy use doubled to 200 million BTU, and reached 300 million BTU by the late 60s. After a peak of 360 million BTU in 1979, per capita consumption generally declined, and dipped below 300 million BTU in 2020.[15] In comparison, the world average increased from 68 إلى 74 million BTU (72 إلى 78 GJ) per person between 1980 and 2020.[3]
Domestic oil production peaked in 1970 and did not recover for 40 years. However, oil imports allowed consumption to double. Oil represented the vast majority of net imports during this time.[16] Increased reliance on imported oil coincided with the 1973 oil crisis.
Total imports peaked in 2005, when they represented 30% of total consumption. A consistent decline occurred over the next 15 years, as oil production doubled and domestic use receded. This allowed the United States to be a net exporter of energy for the first time in 70 years. As of 2021, the US net exports 3.9% of energy production.[16]
Around 2010, many other trends began to reverse. By 2020, improvements in fracking had allowed natural gas production to increase by more than half,[17] while coal decreased by half.
Renewables in the 20th century consisted mainly of hydro and wood. Hydro power had been relatively constant since 1970, while wood saw a bump in 1980. Between 2000 and 2020, wind, solar and biofuels increased by a factor of ten. By 2020, wind had surpassed hydro, and biofuels had surpassed wood.[18]
ملخص
|
 US energy flow, 2022. Note the loss of waste energy due to the nature of heat engines. |
|
الانتاج الرئيسي للطاقة

The United States is the world's second-largest producer of energy. It produces 16% of the world's energy, about three-fourths as much as China.[3] Since 2019, the country has been a net exporter of energy. In 2021, 97.8 quads were produced and net exports were 3.9% of production.[16]
الوقود الأحفوري
Fossil fuels have long produced most energy in the US, currently accounting for 79% of total production[20] and 61% of electric generation.[12] Although costs for some fossil fuels are declining, renewables are becoming cheaper faster.[21] Despite this, use of fossil fuels has remained near 80% for the past 30 years.[20]
The vast majority of carbon emissions in the US came from fossil fuels.[22] The largest sources for carbon pollution from energy were petroleum (46%), natural gas (35%) and coal (19%),[23] and of petroleum, motor gasoline (21%) and diesel (12%) were the largest contributors. As gas has been replacing coal, emissions from the two combined have declined from a peak in 2008, down 25% as of 2021. During the same time frame, petroleum declined by only 17%.
الفحم
Coal made up 11% of production in 2021,[20] 90% of which went to producing electricity.[12] Coal electrified rapidly throughout the 50s, 60s and 70s and half of annual electricity was from coal until the 2010s. Coal peaked in 2006, when it represented a third of total energy production. During the 2010s it underwent a steady decline, mostly being replaced by natural gas. In contrast, net exports have remained near 2 quads in the same time period, but this now amounts to 17% of total production.[24]
The decline of coal has many factors, including the aforementioned rise of natural gas, the closing of old plants, and environmental regulations.[25] Coal supply has not become an issue, as the US has the largest coal reserve in the world, 40% larger than Russia.[3]
The first DC plant in the US was a coal plant in New York City, opened in 1882. The first AC plant was a coal plant in Ehrenfeld, Pennsylvania, opened in 1902.[26] Among the largest plants still operating is the James H. Miller Jr. Electric Generating Plant in West Jefferson, Alabama[27] and among the oldest is the James E. Rogers Energy Complex in Mooresboro, North Carolina.[28]
الغاز الطبيعي


Dry natural gas was 36% of production in 2021, making it the largest source of energy in the US.[20] It is also the largest electricity source, making up 38% of generation.[12] Natural gas surpassed coal for production in 2011 and for generation in 2016. Between 2006 and 2022, the US has gone from net importing 4 quads of natural gas to exporting 4 quads.[24]
The United States has been the world's largest producer of natural gas since 2011, when it surpassed Russia. However, the US ranks 7th in proven reserves.[3] Differences in supply explain why gas is cheaper in the US than it is in Europe.[29]
Among the largest natural gas power plants in the US is West County Energy Center in Palm Beach County, Florida.[30] Philadelphia had the first natural gas distributor in the US.[31]
Natural gas liquids are liquid hydrocarbons obtained from natural gas fields. Production has tripled from 2000 to 2022, now making up 9% of fossil fuels.[20] The US leads the world in NGL production, ahead of Saudi Arabia.[3]
During the 2023-24 winter heating season in the United States, natural gas inventories ended at 2,290 billion cubic feet (Bcf), 39% above the five-year average, due to mild weather resulting in reduced consumption. Withdrawals from storage were approximately 1,500 Bcf, lower than the usual 2,000 Bcf. By March 2024, the Henry Hub spot price had decreased to $1.50 per million British thermal units (MMBtu), significantly below the forecasted $3.10/MMBtu, with expectations of prices staying below $2.00/MMBtu until the second half of 2024, averaging $2.20/MMBtu for the year[32]
النفط

Crude oil made up 24% of production in 2021.[20] Oil has more than doubled from a slump in the early 2000s, even surpassing its previous peak in 1970. Imports have declined during the same time period, but the US still net imports 20% of consumption.[24]
The US has been the largest producer of crude oil since 2018, ahead of Saudi Arabia.[3] Texas produces far more oil than any other state.[33]
النووي

Nuclear power was 8.3% of total production[20] and 18.8% of electric generation[34] in 2021. Seven states made up half the total: Illinois (12%), Pennsylvania (10%), South Carolina (7%), Alabama (6%), North Carolina (6%), Texas (5%) and Tennessee (5%).
The US generated 772 TWh of nuclear power in 2022, surpassing China (395 TWh) and France (282 TWh). However, nuclear power constitutes a much smaller percentage of total power generation (18%) when compared to France (63%).[35]
Nuclear had significant growth from the 70s through the 90s, but has stagnated since.[20] A cessation of new nuclear plant construction coincided with the accident at Three Mile Island.[36] Future growth may come from smaller reactors.[37]
Among the largest nuclear plants in the US are Grand Gulf in Claiborne County, Mississippi and Peach Bottom in York County, Pennsylvania.[38] The oldest reactor still in commercial operation is Nine Mile Point in Scriba, New York.[39]
المتجددة

Renewable energy in the United States accounted for 12.5% of the total production in 2021,[20] and 20.7% of electric generation.[34] The category has seen rapid growth, doubling in total output between 2000 and 2020. They have exceeded nuclear since 2011 and surpassed coal in 2020 for the first time since wood fuel fell out of use.[20]
Renewables are expected to continue growing.[40] Because many of these are variable renewable energy, there are plans for considerable growth in battery storage.[41]
بيوماس


Biomass made up 5% of total production and 38% of renewables in 2022.[20] About 49% of this was biofuels, 43% was wood, and 8% was waste and other biomass.
Ethanol made up the majority of biofuels in 2022, while biodiesel and renewable diesel made up about 16%. For ethanol, about 40% of the available energy is lost or diverted to co-products during the manufacturing process,[42] and the equivalent of 20% is used to power and run the equipment.[43] About 45% of domestic corn output goes toward producing ethanol.[44] The US led the world in ethanol production in 2021, producing more than half of the total.[45] The US is a net exporter of biofuels.
Use of biofuels increased by a factor of 10 between 2000 and 2020, eventually exceeding wood.[18] The desire for ethanol originated from the need to replace methyl tert-butyl ether, which was contaminating groundwater.[46] The Energy Policy Act of 2005 mandated an increased use of ethanol.[47] Most gasoline sold in the US contains up to 10% ethanol.[48]
Industry uses two-thirds of the wood fuel in the US, while the residential sector uses about a quarter. Wood and paper factories use wood waste on-site to reduce their energy costs. About 9% of homes used firewood in 2020.[49]
Wood made up the majority of energy consumption until near the end of the 1800s, after which it declined in total use for several decades, to about half its peak.[9] The 80s saw the first significant increase in over a century, of about 65%, before declining again by the 2010s.[18]
Geothermal

Two-thirds of the geothermal energy in the US in 2021 was electric, with the remainder being direct use and heat pumps.[18][50] Geothermal power made up 2% of renewable generation,[34] 70% of which came from California.[51] The Geysers is the largest complex of geothermal energy production in the world.[52] The US ranks first in geothermal capacity, ahead of Indonesia and the Philippines.[53]
المائية

Hydro made up 6% of electric generation and 29% of renewable generation in 2021.[34] Three states made up over half of the total: Washington (29%), New York (12%) and Oregon (11%).[51] Overall 246 TWh were generated across 1,449 conventional plants and 40 pumped storage plants.[54] As of 2021, the US was fourth in the world in total hydroelectric generation behind Canada and Brazil, each generating over 350 TWh. China produced the most, with an estimated 1,300 TWh.[53]
Hydro has been used in the US since 1880 when it powered the Wolverine Chair factory in Grand Rapids, Michigan.[55] By 1950, 29% of total electricity production came from hydro, as it produced 96 TWh.[6] Hydro generation had tripled by the 70s, but has not consistently grown since. Hydro has had large flucuations from year to year: for example in 2010, generation jumped from 253 to 311 TWh the next year, before dropping to 269 TWh the year after that. While hydro has maintained generation in the 200 to 350 TWh range for the past few decades, its share of the total has declined as other sources have risen. Since 2019, wind power has exceeded hydro as the largest renewable electricity source.[6]
At 132 years old, the plant in Whiting, Wisconsin is the oldest power plant still running in the US.[55] The Grand Coulee Dam is the largest plant for hydro and in general in the US, and the fifth-largest hydro plant in the world. Built in Washington in 1942, it continues to operate with a capacity of 6,765 MW.[55] The Bath County Pumped Storage Station is the second-largest such facility in the world, with a capacity of 3,003 MW.[56]
الشمسية

Solar made up 4% of electric generation and 19% of renewable generation in 2021. Of the 164 TWh generated, 70% was by utilities and an estimated 30% was small-scale such as rooftop solar.[34] Three states made up over half of total grid generation: California (30%), Texas (13%) and North Carolina (9%).[51] In 2021, the US grid produced the second most solar power in the world, behind China's 328 GWh.[53]
Since 2006, solar has been the fastest growing energy source in the US, expanding 50% per year on average.[12] The largest solar farms in the US include Solar Star in Rosamond, California, Desert Sunlight in Desert Center, California and Copper Mountain in Boulder City, Nevada.[57] The Bureau of Land Management leases federal land to be used for solar farms.[58]
Almost all states employ net metering to compensate owners of small-scale solar, although policies by state vary considerably.[59]
الطاقة

Wind made up 9% of electric generation and 44% of renewable generation in 2021.[34] Four states made up over half of the total: Texas (26%), Iowa (10%), California (9%) and Kansas (7%).[51] The US grid produces significantly more wind power than Germany or India, but less than half of China.[53]
Since 1998, wind power has grown 23% per year on average in the US.[12] Prominent areas for wind turbines include Alta Wind in Kern County, California, Shepherds Flat in Gilliam County, Oregon and Roscoe Wind Farm in Nolan County, Texas.[57]
استهلاك الطاقة النهائي


.jpg&filetimestamp=20240702020253&)

.jpg&filetimestamp=20240702020241&)
Industry has long been the country's largest energy sector.[4][5] It used 33% of total energy in 2021, most of which was divided evenly between natural gas, electricity and petroleum. A survey from 2018 estimated that the largest energy users were the chemical industry (30%), petroleum and coal processing (18%), mining (9%) and paper (9%).[60]
The most energy-intensive industry was by far petroleum and coal, at over 30 billion BTU per employee. The paper industry was second at 6.5 billion BTU per employee. Each of these handles energy sources as part of their raw materials (fossil fuels and wood).[61] The same survey found that half of the electric use was to drive machines and about 10% each for heating, cooling and electro-chemical processes. Most of the remainder was for factory lighting and HVAC. About half of the natural gas was for process heating, and most of the rest was for boilers.[62]
Transportation used 28% of energy, almost all of which was petroleum and other fuels. Half of the combustible fuels that make up the transportation sector were gasoline, and half of the vehicle usage was for cars and small trucks.[63] Diesel and heavier trucks each made up about a quarter of their respective categories; jet fuel and aircraft were about a tenth each. Biofuels such as ethanol and biodiesel made up 5%, while natural gas was 4%. Electricity from mass transit was 0.2%; electricity for light passenger vehicles is counted in other sectors, but figures from the US Department of Energy estimate that 2.1 million electric vehicles used 6.1 TWh to travel 19 billion miles, indicating an average fuel efficiency of 3.1 miles per kWh.[64]
Over two-thirds of the energy used by homes, offices, and other commercial businesses is electric, including electric losses.[65][66] Most of the energy used in homes was for space heating (34%) and water heating (19%), much more than the amount used for space cooling (16%) and refrigeration (7%).[67] Businesses use similar percentages for space cooling and refrigeration. They use less for space and water heating but more for lighting and cooking.[68]
Most homes in the US are single-family detached,[69] which on average use almost triple the energy of apartments in larger buildings.[70] However, single family households have 50% more persons and triple the floor space. Usage per square foot of living space is roughly equal for most housing types except small apartment buildings and mobile homes. Small apartments are more likely to be older than other housing types,[71] while mobile homes tend to have poor insulation.[72]
التفاوت الإقليمي
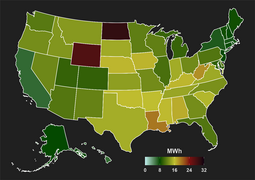
The state with the lowest per capita energy use is Rhode Island, at 161 million BTU per year, and the highest is Louisiana, at 908 million BTU per year. Energy use and prices often have an inverse relationship; Hawaii uses some of the least energy per capita but pays the highest price on average, while Louisiana pays the least on average.[73]
Residential prices follow a similar trend, but the differences between states are usually less drastic. The exception is Hawaii, which pays 84 cents per million BTU, more than double the next largest state of Florida, which pays 33 cents.[74]
Household energy use varies by home type and by region. Although single-family detached homes are less common in the Northeast, the average house there uses 60% more energy than one in the West. Some of the regional differences can be explained by climate, as two-thirds of northeastern homes are in cold regions, while less than a third of western homes are.[75][76]
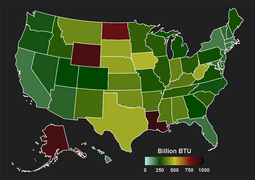
Overall use per capita
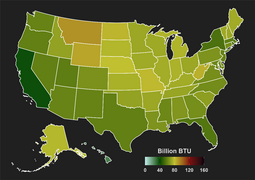
Home use per capita
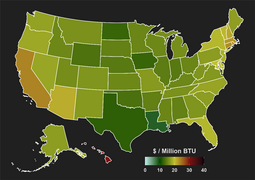
Overall price per million BTU
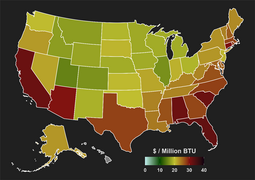
Home price per million BTU


The land-use decisions of cities and towns also explain some of the regional differences in energy use. Townhouses are more energy efficient than single-family homes because less heat, for example, is used per person. Similarly, areas with more homes in a compact neighborhood encourage walking, biking and transit, thereby reducing transportation energy use. A 2011 U.S. EPA study found that multi-family homes in urban neighborhoods, with well-insulated buildings and fuel-efficient cars, use less than two-thirds of the energy used by conventionally built single-family houses in suburban areas (with standard cars).[77]
الكهرباء

The United States is the world's second-largest producer and consumer of electricity. It generates 15% of the world's electricity supply, about half as much as China.[78]
The United States produced 3,988 TWh in 2021. Total generation has been flat since 2010. Net electricity imports were 39 TWh, or about 1% of sales. Historically, net imports have been between just under 0% to just over 1.5%.[6]
Fossil fuels made up the majority of generation, with natural gas providing 38% and coal 23%. Petroleum provided less than 1%. Natural gas as a proportion of fossil fuels has been increasing since the 90's, with coal peaking around 2008 and natural gas becoming the top fossil fuel in 2016.[12]
Nuclear provided 20%, a level consistent since about 1990. Nuclear surpassed coal in 2020 for the first time, as coal dipped to its lowest proportion in over 70 years.
Among renewables, wind and solar continued to expand, with wind exceeding hydro since 2019. Renewable use has doubled from 2010 to 2020, reaching 21% of total generation.
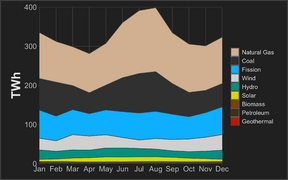
Monthly TWh by source

Monthly TWh by renewable source
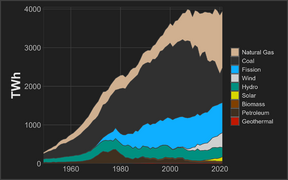
Yearly TWh by source
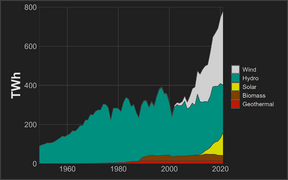
Yearly TWh by renewable source


سعة الشبكة
The United States had a nameplate generation capacity of 1,213 GW in 2021.[7] The following table summarizes the electrical energy generated by fuel source for the United States grid in 2021. Figures account for generation losses, but not transmission losses. Fission had the highest capacity factor, while petroleum had the lowest.
The US grid first connected East and West in 1967.[79] There are over 7,300 power plants and almost 160,000 miles of high voltage lines.[80]
|
|


التوليد حسب الولاية

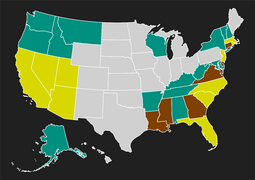
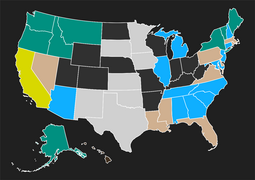
The following figures offer detail into the sources of generation used in each state.[51] Most often, natural gas is the largest source in a given state, with 22 states using it more than any other. Among renewable sources, 18 states use wind power more than any other.
Though not always the most prominent source, each state will use at least one source at a rate above the national average. Twelve states use nuclear power more than average, and California and Hawaii each use more solar and petroleum, respectively.
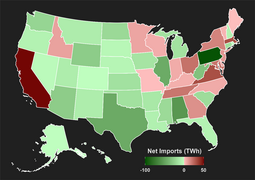
Texas contributes more to the grid than any other state, followed by Florida, Pennsylvania and California. On net, Pennsylvania exports the most power, while California imports the most.
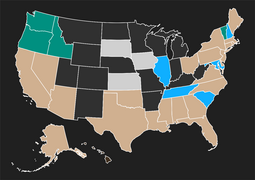
Largest generation source
Largest renewable generation source
Most over-represented source
Net electricity imports/exports


استهلاك الكهرباء

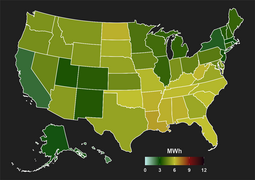
Electric grid consumption in the US was 3,806 TWh in 2021. Since 2010, total consumption has remained within 2% of this figure. Per capita consumption was 11.5 MWh in 2021, down 8% from its peak in 2007.[81][82]
Residential customers used 39% of total electricity.[81] Each month, the average customer used 886 kWh and paid $121 at an average rate of 13.7 cents/kWh.[83] The commercial sector used 35% and industrial used 26%. Transportation used less than half of one percent.
System loss within the grid includes use in the generation process and transmission losses, as well as unaccounted loads. For 2021, this amounted to 203 TWh, or 5.3% of grid generation. Electricity used directly at the commercial or industrial level added 139 TWh, so total consumption was 3,945 TWh.[84]
The northeastern US has long paid the highest electricity prices, while simultaneously using it the least per capita.[85] California is an outlier in the west region; its neighbors tend to pay some of the lowest rates in the country, while California is second only to Hawaii and Alaska.
Overall use per capita
Home use per capita
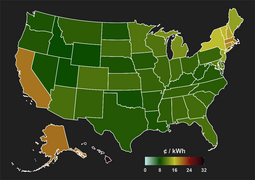
Overall price per kWh
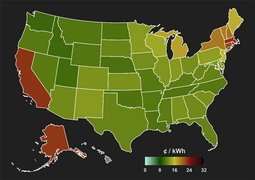
Home price per kWh


انظر أيضاً
- الحفاظ على الطاقة في الولايات المتحدة
- سياسة الطاقة في الولايات المتحدة
- World energy resources
- World energy consumption
- List of countries by energy consumption and production
- List of U.S. states by electricity production from renewable sources
المراجع
- ^ أ ب ت "U.S. energy facts explained". EIA. June 10, 2022. Retrieved April 14, 2023.
- ^ "Monthly Energy Review". EIA. March 28, 2022. Appendix E p2. Retrieved April 19, 2023.
- ^ أ ب ت ث ج ح خ د ذ "International". EIA. Retrieved April 14, 2023.
- ^ أ ب "Monthly Energy Review". EIA. April 25, 2023. 2.1a Energy consumption: Residential, commercial, and industrial sectors. Retrieved May 2, 2023.
- ^ أ ب "Monthly Energy Review". EIA. April 25, 2023. 2.1b Energy consumption: Transportation sector, total end-use sectors, and electric power sector. Retrieved May 2, 2023.
- ^ أ ب ت ث ج ح "Monthly Energy Review". EIA. March 28, 2022. 7.2b Electric power sector. Retrieved April 14, 2023.
- ^ أ ب ت "Electric Power Annual". EIA. November 7, 2022. 4.3. Existing capacity by energy source. Retrieved April 14, 2023.
- ^ "Bicentennial Edition: Historical Statistics of the United States, Colonial Times to 1970". US Census. September 1975. p8. Retrieved April 14, 2023.
- ^ أ ب "Monthly Energy Review". EIA. March 28, 2022. Appendix D1 Estimated primary energy consumption in the United States, selected years, 1635–1945. Retrieved April 14, 2023.
- ^ Stelzer, Hank. "Wood Fuel for Heating". extension.missouri.edu (in الإنجليزية). Retrieved 2023-04-13.
- ^ Adams, Sean Patrick. "The US Coal Industry in the Nineteenth Century". EH.net. Retrieved 2023-04-13.
- ^ أ ب ت ث ج ح خ د "Monthly Energy Review". EIA. March 28, 2022. 7.2a Total (all sectors). Retrieved April 14, 2023.
- ^ "Transportation Energy Data Book" (PDF). ORNL. June 2022. p85. Retrieved April 14, 2023.
- ^ "Age of Natural Gas Pipelines". Pipeline Safety Trust. Retrieved April 14, 2023.
- ^ "Monthly Energy Review". EIA. March 28, 2022. 1.7 Primary energy consumption, energy expenditures, and carbon dioxide emissions indicators. Retrieved April 14, 2023.
- ^ أ ب ت "U.S. energy facts explained". EIA. June 10, 2022. Imports & Exports. Retrieved April 14, 2023.
- ^ Kemp, John (2022-11-23). "Column: Is the U.S. shale oil revolution over?". Reuters. Retrieved 2023-04-13.
- ^ أ ب ت ث "Monthly Energy Review". EIA. March 28, 2022. 10.1 Production and consumption by source. Retrieved April 14, 2023.
- ^ Electricity only includes mass transit."Energy use for Transport". EIA. June 17, 2022. Retrieved May 2, 2023.
- ^ أ ب ت ث ج ح خ د ذ ر ز س ش "Monthly Energy Review". EIA. March 28, 2023. 1.2 Primary energy production by source. Retrieved April 14, 2023.
- ^ "Why did renewables become so cheap so fast?". EIA. December 1, 2020. Retrieved June 30, 2023.
- ^ "Sources of Greenhouse Gas Emissions". EPA. April 28, 2023. Retrieved June 30, 2023.
- ^ "Monthly Energy Review". EIA. April 25, 2023. 11.1 By source. Retrieved June 30, 2023.
- ^ أ ب ت "Monthly Energy Review". EIA. June 27, 2023. 1.4c Primary energy net imports by source. Retrieved June 29, 2023.
- ^ "What Is Killing the US Coal Industry?". SIEPR. March 1, 2017. Retrieved June 29, 2023.
- ^ "History of U.S. Coal Use". energybc.ca. Retrieved June 29, 2023.
- ^ "Alabama coal plant still the largest greenhouse gas emitter in United States". al.com. December 6, 2022. Retrieved June 29, 2023.
- ^ "Rogers Energy Complex". Duke Energy. Retrieved June 29, 2023.
- ^ "Global natural gas prices vary considerably". EIA. September 30, 2011. Retrieved June 29, 2023.
- ^ "The 10 Biggest Power Plants in the U.S." arnolditkin.com. September 9, 2022. Retrieved June 29, 2023.
- ^ "A Brief History of Natural Gas". arnolditkin.com. Retrieved June 29, 2023.
- ^ EIA, U.S. Energy Information Administration (2024-04-11). "Mild winter weather may lead to persistently high natural gas inventories through 2025". www.eia.gov. Retrieved 14 April 2024.
- ^ "Oil and petroleum products explained". EIA. September 16, 2022. Retrieved June 29, 2023.
- ^ أ ب ت ث ج ح "Electric Power Annual". EIA. November 7, 2022. 3.1.A. Net generation by energy source: Total (all sectors). Retrieved May 5, 2023.
- ^ "Nuclear Share of Electricity Generation in 2021". EIA. May 14, 2023. Retrieved May 15, 2023.
- ^ "Three Mile Island represented the power and peril of nuclear energy. Now it's closed". Washington Post. September 26, 2019. Retrieved May 15, 2023.
- ^ "Nuclear industry hopes to expand output with new reactors". AP News. June 21, 2022. Retrieved May 15, 2023.
- ^ "Leading nuclear power reactors in operation worldwide as of December 2021, by gross capacity". Statista. August 1, 2022. Retrieved June 30, 2023.
- ^ "How old are U.S. nuclear power plants, and when was the newest one built?". EIA. March 7, 2022. Retrieved June 30, 2023.
- ^ "EIA projects that renewable generation will supply 44% of U.S. electricity by 2050". EIA. December 8, 2022. Retrieved May 15, 2023.
- ^ "U.S. battery storage capacity will increase significantly by 2025". EIA. March 18, 2022. Retrieved May 15, 2023.
- ^ "Monthly Energy Review". EIA. March 28, 2022. 10.3 Fuel ethanol overview. Retrieved April 15, 2023.
- ^ "2018 MECS Survey Data". EIA. February 23, 2021. 5.2 By Manufacturing Industry with Net Electricity p64. Retrieved April 15, 2023.
- ^ "Feed Grains Sector at a Glance". USDA ERS. January 27, 2023. Retrieved April 29, 2023.
- ^ "World Fuel Ethanol Production by Region". RFA. Retrieved April 15, 2023.
- ^ "Short-Term Energy Outlook". EIA. April 2001. 2001: MTBE Production Economics. Retrieved April 15, 2023.
- ^ "History of Ethanol Production and Policy". ag.ndsu.edu. Retrieved April 15, 2023.
- ^ "Ethanol Blends". AFDC. Retrieved April 15, 2023.
- ^ "Biomass explained". EIA. June 2, 2022. Wood and wood waste. Retrieved April 15, 2023.
- ^ "Monthly Energy Review". EIA. April 25, 2023. 10.2c Consumption: transportation and electric power sectors. Retrieved May 12, 2023.
- ^ أ ب ت ث ج "Historical State Data". EIA. March 8, 2023. Net Generation by State by Type of Producer by Energy Source. Retrieved April 14, 2023.
- ^ "Largest Geothermal Power Plants In The World". World Atlas. April 25, 2017. Retrieved May 12, 2023.
- ^ أ ب ت ث "Country Rankings". IRENA. March 25, 2023. Retrieved April 29, 2023.
- ^ "Electric Power Annual". EIA. November 7, 2022. 4.1. Count of electric power industry power plants, by sector, by predominant energy sources within plant. Retrieved April 29, 2023.
- ^ أ ب ت "Hydropower explained". EIA. April 20, 2023. Hydropower has a long history. Retrieved April 29, 2023.
- ^ "Largest pumped storage plants in operation and development". NS Energy. May 13, 2020. Retrieved April 29, 2023.
- ^ أ ب "Form EIA-923 detailed data". EIA. April 27, 2023. Retrieved May 12, 2023.
- ^ "Solar Energy Zones". BLM. Retrieved May 12, 2023.
- ^ "2022 UPDATE: Which states offer net metering?". Solar Power World. April 1, 2022. Retrieved May 15, 2023.
- ^ "Energy use in industry". EIA. June 13, 2022. Retrieved May 3, 2023.
- ^ "2018 MECS Survey Data". EIA. August 27, 2021. Table 6.1 By Manufacturing Industry and Region. Retrieved May 3, 2023.
- ^ "2018 MECS Survey Data". EIA. August 27, 2021. Table 5.4 By Manufacturing Industry with Total Consumption of Electricity. Retrieved May 3, 2023.
- ^ "Energy use for transportation". EIA. June 28, 2022. 1.1 Primary energy overview. Retrieved May 3, 2023.
- ^ "US: In 2021, Plug-Ins Traveled 19 Billion Miles On Electricity". InsideEVs. November 29, 2022. Retrieved August 6, 2023.
- ^ "Monthly Energy Review". EIA. April 25, 2023. 2.2 Residential sector energy consumption. Retrieved May 3, 2023.
- ^ "Monthly Energy Review". EIA. April 25, 2023. 2.3 Commercial sector energy consumption. Retrieved May 3, 2023.
- ^ Assuming electric losses of about 65%. "Energy use in homes". EIA. June 14, 2022. Retrieved May 3, 2023.
- ^ Assuming ventilation is roughly proportional for heating and cooling. "2018 CBECS Survey Data". EIA. December 21, 2022. End-use consumption. Retrieved May 3, 2023.
- ^ "Table HC9.1 Household demographics of U.S. homes by housing unit type, 2015". EIA. May 2018. Retrieved May 3, 2023.
- ^ "2015 RECS Survey Data". EIA. May 2018. CE1.1 Summary consumption and expenditures in the U.S. - totals and intensities. Retrieved May 3, 2023.
- ^ "Table HC2.3 Structural and geographic characteristics of U.S. homes by year of construction, 2015". EIA. May 2018. Retrieved May 3, 2023.
- ^ "Table HC2.1 Structural and geographic characteristics of U.S. homes by housing unit type, 2015". EIA. May 2018. Retrieved May 3, 2023.
- ^ "State Energy Data System". EIA. June 24, 2022. Consumption: Total energy consumption per capita by end-use sector. Retrieved April 14, 2023.
- ^ "State Energy Data System". EIA. June 24, 2022. Prices and Expenditures: Prices Total End-use. Retrieved May 15, 2023.
- ^ "2015 RECS Survey Data". EIA. May 2018. CE1.2 Summary consumption and expenditures in the Northeast - totals and intensities. Retrieved May 15, 2023.
- ^ "2015 RECS Survey Data". EIA. May 2018. CE1.5 Summary consumption and expenditures in the West - totals and intensities. Retrieved May 15, 2023.
- ^ "Location Efficiency and Housing Type: Boiling It Down to BTUs". EIA. April 18, 2023. Retrieved May 15, 2023.
- ^ "International". EIA. Electricity. Retrieved April 14, 2023.
- ^ "When the Grid Was the Grid: The History of North America's Brief Coast-to-Coast Interconnected Machine". ieee.org. January 1, 2019. Retrieved June 30, 2023.
- ^ "U.S. Electricity Grid & Markets". EPA. April 18, 2023. Retrieved June 30, 2023.
- ^ أ ب "Monthly Energy Review". EIA. March 28, 2022. 7.6 Electricity end use. Retrieved April 14, 2023.
- ^ "Monthly Energy Review". EIA. March 28, 2022. Appendix C1 Population, U.S. gross domestic product, and U.S. gross output. Retrieved April 14, 2023.
- ^ "Monthly Energy Review". EIA. March 28, 2022. 9.8 Average prices of electricity to ultimate customers. Retrieved April 14, 2023.
- ^ "Monthly Energy Review". EIA. March 28, 2022. 7.1 Overview. Retrieved April 14, 2023.
- ^ "Historical State Data". EIA. April 27, 2023. EIA-861 Annual Electric Power Industry Report. Retrieved May 15, 2023.