مقاطعة كلارك، مزوري
مقاطعة كلارك إنگليزية: Clark County هي إحدى المقاطعات في ولاية مزوري في الولايات المتحدة.
Clark County | |
|---|---|
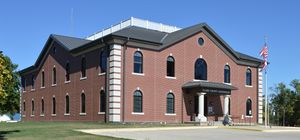
 Clark County Courthouse in Kahoka | |
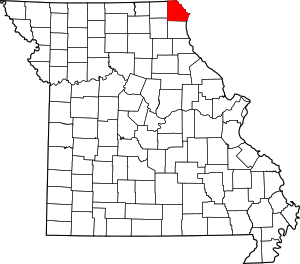
 Location within the U.S. state of Missouri | |
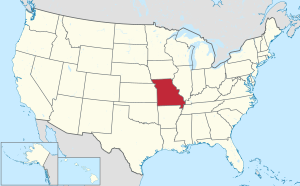
 موقع Missouri ضمن الولايات المتحدة | |
| الإحداثيات: Coordinates: 40°25′N 91°44′W / 40.41°N 91.74°W | |
| البلد | |
| State | |
| تأسست | 16 ديسمبر, 1836 |
| السمِيْ | وليام كلارك |
| Seat | كاهوكا |
| Largest city | كاهوكا |
| المساحة | |
| • الإجمالي | 512 ميل² (1٬330 كم²) |
| • البر | 505 ميل² (1٬310 كم²) |
| • الماء | 7٫1 ميل² (18 كم²) 1.4% |
| التعداد (2010) | |
| • الإجمالي | 7٬139 |
| • Estimate (2018) | 6٬842 |
| • الكثافة | 14/sq mi (5٫4/km2) |
| منطقة التوقيت | UTC−6 (Central) |
| • الصيف (التوقيت الصيفي) | UTC−5 (CDT) |
| Congressional district | 6th |
. . . . . . . . . . . . . . . . . . . . . . . . . . . . . . . . . . . . . . . . . . . . . . . . . . . . . . . . . . . . . . . . . . . . . . . . . . . . . . . . . . . . . . . . . . . . . . . . . . . . . . . . . . . . . . . . . . . . . . . . . . . . . . . . . . . . . . . . . . . . . . . . . . . . . . . . . . . . . . . . . . . . . . . .
الجغرافيا
المقاطعات المجاورة
- مقاطعة ڤان بيورن، أيوا (الشمال)
- مقاطعة لي، أيوا (الشمال الشرقي)
- Hancock County, Illinois (east)
- Lewis County (south)
- Knox County (southwest)
- Scotland County (west)
الطرق السريعة الرئيسية
الأماكن المحمية الوطنية
الديمغرافيا
| التعداد التاريخي | |||
|---|---|---|---|
| التعداد | Pop. | %± | |
| 1840 | 2٬846 | — | |
| 1850 | 5٬527 | 94٫2% | |
| 1860 | 11٬684 | 111٫4% | |
| 1870 | 13٬667 | 17�0% | |
| 1880 | 15٬031 | 10�0% | |
| 1890 | 15٬126 | 0٫6% | |
| 1900 | 15٬383 | 1٫7% | |
| 1910 | 12٬811 | −16٫7% | |
| 1920 | 11٬874 | −7٫3% | |
| 1930 | 10٬254 | −13٫6% | |
| 1940 | 10٬166 | −0٫9% | |
| 1950 | 9٬003 | −11٫4% | |
| 1960 | 8٬725 | −3٫1% | |
| 1970 | 8٬260 | −5٫3% | |
| 1980 | 8٬493 | 2٫8% | |
| 1990 | 7٬547 | −11٫1% | |
| 2000 | 7٬416 | −1٫7% | |
| 2010 | 7٬139 | −3٫7% | |
| 2018 (تق.) | 6٬842 | [1] | −4٫2% |
| U.S. Decennial Census[2] 1790-1960[3] 1900-1990[4] 1990-2000[5] 2010-2015[6] | |||
السياسة
المحلية
The Republican Party controls politics at the local level in Clark County. As of 2018, Republicans hold nine of fourteen of the elected positions in the county.
قالب:Missouri county elected officials
الولائية
| Year | Republican | Democratic | Third Parties |
|---|---|---|---|
| 2016 | 62.34% 2,053 | 34.74% 1,144 | 2.92% 96 |
| 2012 | 40.78% 1,312 | 56.64% 1,822 | 2.58% 83 |
| 2008 | 51.33 % 1,772 | 46.00% 1,588 | 1.67% 92 |
| 2004 | 66.98% 2,469 | 30.63% 1,129 | 2.38% 88 |
| 2000 | 46.47% 1,751 | 51.17% 1,928 | 2.36% 89 |
| 1996 | 29.87% 966 | 68.46% 2,214 | 1.67% 54 |
All of Clark County is included in Missouri’s 4th District in the Missouri House of Representatives and is represented by Craig Redmon (R-Canton).
| Missouri House of Representatives — District 4 — Clark County (2016) | |||||
|---|---|---|---|---|---|
| الحزب | المرشح | الأصوات | % | ±% | |
| Republican | Craig Redmon | 2,818 | 100.00% | ||
| Missouri House of Representatives — District 4 — Clark County (2014) | |||||
|---|---|---|---|---|---|
| الحزب | المرشح | الأصوات | % | ±% | |
| Republican | Craig Redmon | 1,794 | 100.00% | ||
| Missouri House of Representatives — District 4 — Clark County (2012) | |||||
|---|---|---|---|---|---|
| الحزب | المرشح | الأصوات | % | ±% | |
| Republican | Craig Redmon | 2.582 | 100.00% | ||
All of Clark County is a part of Missouri’s 18th District in the Missouri Senate and is currently represented by Brian Munzlinger (R-Williamstown).
| Missouri Senate — District 18 — Clark County (2014) | |||||
|---|---|---|---|---|---|
| الحزب | المرشح | الأصوات | % | ±% | |
| Republican | Brian Munzlinger | 1,837 | 100.00% | ||
. . . . . . . . . . . . . . . . . . . . . . . . . . . . . . . . . . . . . . . . . . . . . . . . . . . . . . . . . . . . . . . . . . . . . . . . . . . . . . . . . . . . . . . . . . . . . . . . . . . . . . . . . . . . . . . . . . . . . . . . . . . . . . . . . . . . . . . . . . . . . . . . . . . . . . . . . . . . . . . . . . . . . . . .
الفدرالية
| U.S. Senate — Missouri — Clark County (2016) | |||||
|---|---|---|---|---|---|
| الحزب | المرشح | الأصوات | % | ±% | |
| Republican | Roy Blunt | 2,037 | 62.16% | +22.17 | |
| Democratic | Jason Kander | 1,059 | 32.32% | -23.90 | |
| Libertarian | Jonathan Dine | 98 | 2.99% | -0.80 | |
| Green | Johnathan McFarland | 40 | 1.22% | +1.22 | |
| Constitution | Fred Ryman | 43 | 1.31% | +1.31 | |
| U.S. Senate — Missouri — Clark County (2012) | |||||
|---|---|---|---|---|---|
| الحزب | المرشح | الأصوات | % | ±% | |
| Republican | Todd Akin | 1.288 | 39.99% | ||
| Democratic | Claire McCaskill | 1,811 | 56.22% | ||
| Libertarian | Jonathan Dine | 122 | 3.79% | ||
All of Clark County is included in Missouri’s 6th Congressional District and is currently represented by Sam Graves (R-Tarkio) in the U.S. House of Representatives.
| U.S. House of Representatives — Missouri's 6th Congressional District — Clark County (2016) | |||||
|---|---|---|---|---|---|
| الحزب | المرشح | الأصوات | % | ±% | |
| Republican | Sam Graves | 2,413 | 75.24% | +3.79 | |
| Democratic | David M. Blackwell | 673 | 20.99% | -4.49 | |
| Libertarian | Russ Lee Monchil | 68 | 2.12% | -0.95 | |
| Green | Mike Diel | 53 | 1.65% | +1.65 | |
| مجلس النواب الأمريكي — دائرة الكونگرس السادسة في مزوري — مقاطعة كلارك (2014) | |||||
|---|---|---|---|---|---|
| الحزب | المرشح | الأصوات | % | ±% | |
| Republican | Sam Graves | 1,464 | 71.45% | +13.75 | |
| Democratic | Bill Hedge | 522 | 25.48% | -13.91 | |
| Libertarian | Russ Lee Monchil | 63 | 3.07% | +0.16 | |
| U.S. House of Representatives — Missouri's 6th Congressional District — Clark County (2012) | |||||
|---|---|---|---|---|---|
| الحزب | المرشح | الأصوات | % | ±% | |
| Republican | Sam Graves | 1,746 | 57.70% | ||
| Democratic | Kyle Yarber | 1,192 | 39.39% | ||
| Libertarian | Russ Lee Monchil | 88 | 2.91% | ||
| Year | Republican | Democratic | Third parties |
|---|---|---|---|
| 2016 | 74.1% 2,458 | 21.8% 724 | 4.0% 134 |
| 2012 | 53.6% 1,730 | 43.4% 1,398 | 3.0% 97 |
| 2008 | 51.6% 1,782 | 45.5% 1,572 | 3.0% 102 |
| 2004 | 50.8% 1,899 | 48.0% 1,794 | 1.2% 43 |
| 2000 | 50.0% 1,899 | 47.7% 1,812 | 2.4% 91 |
| 1996 | 32.6% 1,081 | 52.8% 1,749 | 14.6% 483 |
| 1992 | 29.0% 1,039 | 50.6% 1,815 | 20.4% 730 |
| 1988 | 43.5% 1,493 | 56.1% 1,925 | 0.4% 13 |
| 1984 | 56.0% 2,068 | 44.0% 1,627 | |
| 1980 | 56.5% 2,042 | 41.3% 1,494 | 2.2% 78 |
| 1976 | 48.3% 1,582 | 51.3% 1,679 | 0.4% 13 |
| 1972 | 64.0% 2,499 | 36.0% 1,403 | |
| 1968 | 53.6% 2,111 | 37.8% 1,489 | 8.7% 342 |
| 1964 | 42.8% 1,660 | 57.3% 2,223 | |
| 1960 | 56.4% 2,642 | 43.6% 2,039 | |
| 1956 | 54.5% 2,623 | 45.5% 2,193 | |
| 1952 | 58.0% 2,850 | 41.6% 2,045 | 0.5% 23 |
| 1948 | 49.0% 2,264 | 50.9% 2,352 | 0.1% 3 |
| 1944 | 55.6% 2,707 | 44.3% 2,155 | 0.1% 6 |
| 1940 | 53.6% 3,171 | 46.1% 2,728 | 0.3% 18 |
| 1936 | 48.2% 2,812 | 51.4% 3,003 | 0.4% 25 |
| 1932 | 41.8% 2,223 | 57.7% 3,072 | 0.5% 29 |
| 1928 | 59.8% 3,259 | 39.8% 2,170 | 0.3% 18 |
| 1924 | 50.4% 2,948 | 47.3% 2,770 | 2.3% 135 |
| 1920 | 57.5% 3,310 | 41.4% 2,383 | 1.2% 68 |
| 1916 | 50.7% 1,782 | 48.1% 1,692 | 1.2% 42 |
| 1912 | 36.5% 1,214 | 47.7% 1,586 | 15.7% 523 |
| 1908 | 49.5% 1,741 | 49.4% 1,737 | 1.1% 38 |
| 1904 | 50.5% 1,836 | 47.4% 1,724 | 2.1% 76 |
| 1900 | 47.7% 1,899 | 50.8% 2,021 | 1.5% 61 |
| 1896 | 47.9% 1,953 | 51.7% 2,107 | 0.4% 18 |
| 1892 | 47.5% 1,684 | 50.9% 1,807 | 1.6% 56 |
| 1888 | 48.5% 1,724 | 50.4% 1,791 | 1.0% 37 |
. . . . . . . . . . . . . . . . . . . . . . . . . . . . . . . . . . . . . . . . . . . . . . . . . . . . . . . . . . . . . . . . . . . . . . . . . . . . . . . . . . . . . . . . . . . . . . . . . . . . . . . . . . . . . . . . . . . . . . . . . . . . . . . . . . . . . . . . . . . . . . . . . . . . . . . . . . . . . . . . . . . . . . . .
الانتخابات الرئاسية التمهيدية 2008
- Former U.S. Senator Hillary Clinton (D-New York) received more votes, a total of 554, than any other candidate from either party in Clark County during the 2008 presidential primary.
قالب:Missouri Republican primary, 2008 قالب:Missouri Democratic primary, 2008
التجمعات السكنية
المدن
- Alexandria
- Kahoka (county seat)
- Wayland
- Wyaconda
القرى
Census-designated place
Other unincorporated places
بلديات (all inactive)
انظر أيضاً
المراجع
- ^ "Population and Housing Unit Estimates". Retrieved November 29, 2019.
- ^ "U.S. Decennial Census". United States Census Bureau. Archived from the original on April 26, 2015. Retrieved November 14, 2014.
- ^ "Historical Census Browser". University of Virginia Library. Retrieved November 14, 2014.
- ^ "Population of Counties by Decennial Census: 1900 to 1990". United States Census Bureau. Retrieved November 14, 2014.
- ^ "Census 2000 PHC-T-4. Ranking Tables for Counties: 1990 and 2000" (PDF). United States Census Bureau. Retrieved November 14, 2014.
- ^ خطأ استشهاد: وسم
<ref>غير صحيح؛ لا نص تم توفيره للمراجع المسماةQF - ^ Leip, David. "Dave Leip's Atlas of U.S. Presidential Elections". uselectionatlas.org. Retrieved 2018-03-24.
External links
- "Guide to Clark County Missouri" records
- Digitized 1930 Plat Book of Clark County from University of Missouri Division of Special Collections, Archives, and Rare Books

