مقاطعة كارول، مزوري
مقاطعة كارول إنگليزية: Carroll County هي إحدى المقاطعات في ولاية مزوري في الولايات المتحدة الأمريكية.
Carroll County | |
|---|---|
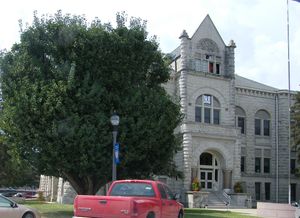
 Carroll County Courthouse in Carrollton | |
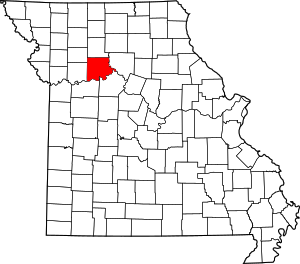
 Location within the U.S. state of Missouri | |
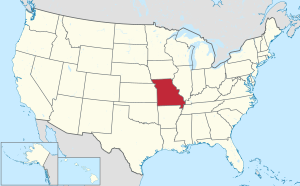
 موقع Missouri ضمن الولايات المتحدة | |
| الإحداثيات: Coordinates: 39°26′N 93°30′W / 39.43°N 93.50°W | |
| البلد | |
| State | |
| تأسست | January 2, 1833 |
| السمِيْ | Charles Carroll of Carrollton |
| Seat | Carrollton |
| Largest city | Carrollton |
| المساحة | |
| • الإجمالي | 701 ميل² (1٬820 كم²) |
| • البر | 695 ميل² (1٬800 كم²) |
| • الماء | 6٫8 ميل² (18 كم²) 1.0%% |
| التعداد | |
| • Estimate (2015) | 8٬992 |
| • الكثافة | 13/sq mi (5/km2) |
| منطقة التوقيت | UTC−6 (Central) |
| • الصيف (التوقيت الصيفي) | UTC−5 (CDT) |
| Congressional district | 6th |
. . . . . . . . . . . . . . . . . . . . . . . . . . . . . . . . . . . . . . . . . . . . . . . . . . . . . . . . . . . . . . . . . . . . . . . . . . . . . . . . . . . . . . . . . . . . . . . . . . . . . . . . . . . . . . . . . . . . . . . . . . . . . . . . . . . . . . . . . . . . . . . . . . . . . . . . . . . . . . . . . . . . . . . .
المقاطعات المجاورة
- Livingston County (الشمال)
- Chariton County (الشرق)
- Saline County (جنوب شرق)
- Lafayette County (جنوب غرب)
- Ray County (الغرب)
- Caldwell County (شمال غرب)
الديمغرافيا
| التعداد التاريخي | |||
|---|---|---|---|
| التعداد | Pop. | %± | |
| 1840 | 2٬423 | — | |
| 1850 | 5٬441 | 124٫6% | |
| 1860 | 9٬763 | 79٫4% | |
| 1870 | 17٬446 | 78٫7% | |
| 1880 | 23٬274 | 33٫4% | |
| 1890 | 25٬742 | 10٫6% | |
| 1900 | 26٬455 | 2٫8% | |
| 1910 | 23٬098 | −12٫7% | |
| 1920 | 20٬480 | −11٫3% | |
| 1930 | 19٬940 | −2٫6% | |
| 1940 | 17٬814 | −10٫7% | |
| 1950 | 15٬589 | −12٫5% | |
| 1960 | 13٬847 | −11٫2% | |
| 1970 | 12٬565 | −9٫3% | |
| 1980 | 12٬131 | −3٫5% | |
| 1990 | 10٬748 | −11٫4% | |
| 2000 | 10٬285 | −4٫3% | |
| 2010 | 9٬295 | −9٫6% | |
| 2016 (تق.) | 8٬913 | [1] | −4٫1% |
| U.S. Decennial Census[2] 1790-1960[3] 1900-1990[4] 1990-2000[5] 2010-2015[6] | |||
السياسة
المحلية
The Republican Party predominantly controls politics at the local level in Carroll County. Republicans hold all but three of the elected positions in the county.
قالب:Missouri county elected officials
الولائية
| Year | Republican | Democratic | Third Parties |
|---|---|---|---|
| 2016 | 65.31% 2,837 | 32.04% 1,392 | 2.65% 115 |
| 2012 | 52.91% 2,256 | 44.61% 1,902 | 2.48% 106 |
| 2008 | 49.48% 2,233 | 48.77% 2,201 | 1.75% 79 |
| 2004 | 60.13% 2,828 | 38.91% 1,830 | 0.96% 45 |
| 2000 | 57.71% 2,643 | 40.87% 1,872 | 1.42% 65 |
| 1996 | 36.21% 1,625 | 62.25% 2,794 | 1.54% 69 |
All of Carroll County is a part of Missouri’s 39th District in the Missouri House of Representatives and is currently represented by Joe Don McGaugh (R-Carrollton).
| Missouri House of Representatives — District 39 — Carroll County (2016) | |||||
|---|---|---|---|---|---|
| الحزب | المرشح | الأصوات | % | ±% | |
| Republican | Joe Don McGaugh | 3,957 | 100.00% | ||
| Missouri House of Representatives — District 39 — Carroll County (2014) | |||||
|---|---|---|---|---|---|
| الحزب | المرشح | الأصوات | % | ±% | |
| Republican | Joe Don McGaugh | 1,844 | 100.00% | +29.96 | |
| Missouri House of Representatives — District 39 — Carroll County (2012) | |||||
|---|---|---|---|---|---|
| الحزب | المرشح | الأصوات | % | ±% | |
| Republican | Joe Don McGaugh | 2,985 | 70.04% | ||
| Democratic | Will Talbert | 1,277 | 29.96% | ||
All of Carroll County is a part of Missouri’s 21st District in the Missouri Senate and is currently represented by Denny Hoskins (R-Warensburg).
| Missouri Senate — District 21 — Carroll County (2016) | |||||
|---|---|---|---|---|---|
| الحزب | المرشح | الأصوات | % | ±% | |
| Republican | Denny Hoskins | 3,353 | 79.89% | +7.21 | |
| Democratic | ElGene Ver Dught | 692 | 16.49% | -6.95 | |
| Libertarian | Bill Wayne | 152 | 3.62% | -0.26 | |
| Missouri Senate — District 21 — Carroll County (2012) | |||||
|---|---|---|---|---|---|
| الحزب | المرشح | الأصوات | % | ±% | |
| Republican | David Pearce | 2,977 | 72.68% | ||
| Democratic | ElGene Ver Dught | 960 | 23.44% | ||
| Libertarian | Steven Hedrick | 159 | 3.88% | ||
الفدرالية
| U.S. Senate — Missouri — Carroll County (2016) | |||||
|---|---|---|---|---|---|
| الحزب | المرشح | الأصوات | % | ±% | |
| Republican | Roy Blunt | 2,875 | 66.20% | +20.43 | |
| Democratic | Jason Kander | 1,290 | 29.70% | -15.59 | |
| Libertarian | Jonathan Dine | 100 | 2.30% | -6.64 | |
| Green | Johnathan McFarland | 38 | 0.87% | +0.87 | |
| Constitution | Fred Ryman | 40 | 0.92% | +0.92 | |
| U.S. Senate — Missouri — Carroll County (2012) | |||||
|---|---|---|---|---|---|
| الحزب | المرشح | الأصوات | % | ±% | |
| Republican | Todd Akin | 1,926 | 45.77% | ||
| Democratic | Claire McCaskill | 1,906 | 45.29% | ||
| Libertarian | Jonathan Dine | 376 | 8.94% | ||
All of Carroll County is included in Missouri’s 6th Congressional District and is currently represented by Sam Graves (R-Tarkio) in the U.S. House of Representatives.
| U.S. House of Representatives — Missouri’s 6th Congressional District — Carroll County (2016) | |||||
|---|---|---|---|---|---|
| الحزب | المرشح | الأصوات | % | ±% | |
| Republican | Sam Graves | 3,496 | 81.28% | -0.52 | |
| Democratic | David M. Blackwell | 681 | 15.83% | +0.50 | |
| Libertarian | Russ Lee Monchil | 89 | 2.07% | -0.80 | |
| Green | Mike Diel | 35 | 0.81% | +0.81 | |
| U.S. House of Representatives — Missouri's 6th Congressional District — Carroll County (2014) | |||||
|---|---|---|---|---|---|
| الحزب | المرشح | الأصوات | % | ±% | |
| Republican | Sam Graves | 1,708 | 81.80% | +3.76 | |
| Democratic | Bill Hedge | 320 | 15.33% | -5.13 | |
| Libertarian | Russ Lee Monchil | 60 | 2.87% | +1.37 | |
| U.S. House of Representatives — Missouri's 6th Congressional District — Carroll County (2012) | |||||
|---|---|---|---|---|---|
| الحزب | المرشح | الأصوات | % | ±% | |
| Republican | Sam Graves | 3,277 | 78.04% | ||
| Democratic | Kyle Yarber | 859 | 20.46% | ||
| Libertarian | Russ Lee Monchil | 63 | 1.50% | ||
| Year | Republican | Democratic | Third parties |
|---|---|---|---|
| 2016 | 79.8% 3,480 | 17.1% 745 | 3.1% 136 |
| 2012 | 71.4% 3,072 | 26.8% 1,154 | 1.8% 78 |
| 2008 | 65.1% 2,955 | 33.8% 1,535 | 1.1% 48 |
| 2004 | 66.6% 3,155 | 33.1% 1,568 | 0.4% 18 |
| 2000 | 62.9% 2,880 | 35.4% 1,620 | 1.8% 81 |
| 1996 | 40.7% 1,839 | 46.1% 2,080 | 13.2% 596 |
| 1992 | 33.0% 1,774 | 39.1% 2,100 | 28.0% 1,504 |
| 1988 | 54.6% 2,811 | 45.3% 2,330 | 0.2% 8 |
| 1984 | 63.8% 3,495 | 36.2% 1,980 | |
| 1980 | 59.0% 3,291 | 38.2% 2,130 | 2.9% 162 |
| 1976 | 48.3% 2,936 | 51.2% 3,114 | 0.4% 27 |
| 1972 | 68.0% 4,100 | 32.0% 1,927 | |
| 1968 | 54.1% 3,680 | 36.4% 2,473 | 9.5% 645 |
| 1964 | 42.4% 2,994 | 57.6% 4,069 | |
| 1960 | 58.0% 4,555 | 42.0% 3,296 | |
| 1956 | 58.1% 4,751 | 41.9% 3,432 | |
| 1952 | 63.1% 5,410 | 36.7% 3,146 | 0.1% 12 |
| 1948 | 55.3% 4,212 | 44.6% 3,401 | 0.1% 5 |
| 1944 | 60.8% 5,127 | 38.9% 3,283 | 0.2% 20 |
| 1940 | 57.4% 6,000 | 42.5% 4,446 | 0.1% 11 |
| 1936 | 51.2% 5,432 | 48.5% 5,141 | 0.3% 32 |
| 1932 | 43.3% 3,894 | 56.3% 5,072 | 0.4% 37 |
| 1928 | 61.1% 5,875 | 38.8% 3,735 | 0.2% 14 |
| 1924 | 51.1% 4,907 | 46.8% 4,502 | 2.1% 204 |
| 1920 | 57.4% 5,609 | 41.7% 4,075 | 1.0% 96 |
| 1916 | 50.7% 2,978 | 48.0% 2,822 | 1.3% 79 |
| 1912 | 26.9% 1,519 | 46.8% 2,648 | 26.4% 1,491 |
| 1908 | 51.6% 3,015 | 47.1% 2,753 | 1.4% 81 |
| 1904 | 51.7% 3,032 | 45.6% 2,673 | 2.8% 163 |
| 1900 | 48.3% 3,192 | 50.0% 3,300 | 1.7% 113 |
| 1896 | 48.2% 3,363 | 50.9% 3,555 | 0.9% 65 |
| 1892 | 46.5% 2,896 | 47.7% 2,969 | 5.8% 362 |
| 1888 | 47.7% 2,929 | 47.3% 2,906 | 5.0% 304 |
. . . . . . . . . . . . . . . . . . . . . . . . . . . . . . . . . . . . . . . . . . . . . . . . . . . . . . . . . . . . . . . . . . . . . . . . . . . . . . . . . . . . . . . . . . . . . . . . . . . . . . . . . . . . . . . . . . . . . . . . . . . . . . . . . . . . . . . . . . . . . . . . . . . . . . . . . . . . . . . . . . . . . . . .
Missouri presidential preference primary (2008)
- Former U.S. Senator Hillary Clinton (D-New York) received more votes, a total of 548, than any candidate from either party in Carroll County during the 2008 presidential primary.
قالب:Missouri Republican primary, 2008 قالب:Missouri Democratic primary, 2008
التجمعات السكنية
المدن
القرى
التجمعات غير المشهرة
- Brunswick
- Coloma
- Miami Station
- Stet
البلدات
- Carrollton Township
- Cherry Valley Township
- Combs Township
- De Witt Township
- Egypt Township
- Eugene Township
- Fairfield Township
- Hill Township
- Hurricane Township
- Leslie Township
- Moss Creek Township
- Prairie Township
- Ridge Township
- Rockford Township
- Stokes Mound Township
- Sugartree Township
- Trotter Township
- Van Horn Township
- Wakenda Township
- Washington Township
أشخاص بارزون
- Leon E. Bates, labor leader
- James Fergason, inventor and business leader in electronics. Known for work with liquid-crystal displays.
انظر أيضاً
الهامش
- ^ "Population and Housing Unit Estimates". Retrieved June 9, 2017.
- ^ "U.S. Decennial Census". United States Census Bureau. Archived from the original on May 12, 2015. Retrieved November 14, 2014.
{{cite web}}: Unknown parameter|deadurl=ignored (|url-status=suggested) (help) - ^ "Historical Census Browser". University of Virginia Library. Retrieved November 14, 2014.
- ^ "Population of Counties by Decennial Census: 1900 to 1990". United States Census Bureau. Retrieved November 14, 2014.
- ^ "Census 2000 PHC-T-4. Ranking Tables for Counties: 1990 and 2000" (PDF). United States Census Bureau. Retrieved November 14, 2014.
- ^ خطأ استشهاد: وسم
<ref>غير صحيح؛ لا نص تم توفيره للمراجع المسماةQF - ^ Leip, David. "Dave Leip's Atlas of U.S. Presidential Elections". uselectionatlas.org. Retrieved 2018-03-24.
للاستزادة
- Turner, S. K. Twentieth century history of Carroll County, Missouri (2 vol 1911) vol 1 online; vol 2 online
وصلات خارجية
- Carroll County Historical Society
- Digitized 1930 Plat Book of Carroll County from University of Missouri Division of Special Collections, Archives, and Rare Books
- Carroll County Sheriff's Office