احتياطيات النفط
احتياطيات النفط (إنگليزية: Oil reserves، تشير إلى كمية النفط الخام الذي يمكن استردادها تقنيًا بتكلفة مجدية ماليًا بسعر النفط الحالي.[1] ومن ثم فإن الاحتياطيات ستتغير مع تغير السعر، على عكس موارد النفط التي تشمل كل النفط الذي يمكن استخراجه تقنيًا بأي ثمن. قد تكون الاحتياطيات لبئر أو خزان أو حقل أو دولة أو العالم. ترتبط التصنيفات المختلفة للاحتياطيات بدرجة اليقين.
The total estimated amount of oil in an oil reservoir, including both producible and non-producible oil, is called oil in place. However, because of reservoir characteristics and limitations in petroleum extraction technologies, only a fraction of this oil can be brought to the surface, and it is only this producible fraction that is considered to be reserves. The ratio of reserves to the total amount of oil in a particular reservoir is called the recovery factor. Determining a recovery factor for a given field depends on several features of the operation, including method of oil recovery used and technological developments.[2]
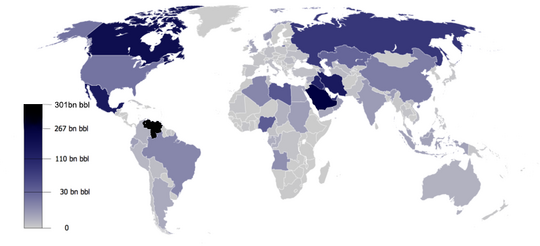
Based on data from OPEC at the beginning of 2013, the highest proven oil reserves, including non-conventional oil deposits, are in Venezuela (20% of global reserves), Saudi Arabia (18% of global reserves), Canada (13% of global reserves), and Iran (9%).[3] Because the geology of the subsurface cannot be examined directly, indirect techniques must be used to estimate the size and recoverability of the resource. While new technologies have increased the accuracy of these techniques, significant uncertainties still remain. In general, most early estimates of the reserves of an oil field are conservative and tend to grow with time. This phenomenon is called reserves growth.[4]
Many oil-producing nations do not reveal their reservoir engineering field data and instead provide unaudited claims for their oil reserves. The numbers disclosed by some national governments are suspected of being manipulated for political reasons.[5][6] In order to achieve international goals for the Decarbonisation, the International Energy Agency said in 2021 that countries no longer need to expand exploration or projects to expand reserves and still meet climate goals set by the Paris Agreement.[7]
التصنيفات
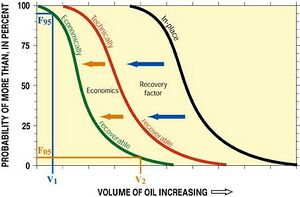
All reserve estimates involve uncertainty, depending on the amount of reliable geologic and engineering data available and the interpretation of that data. The relative degree of uncertainty can be expressed by dividing reserves into two principal classifications—"proven" (or "proved") and "unproven" (or "unproved").[8] Unproven reserves can further be divided into two subcategories—"probable" and "possible"—to indicate the relative degree of uncertainty about their existence.[8] The most commonly accepted definitions of these are based on those approved by the Society of Petroleum Engineers (SPE) and the World Petroleum Council (WPC) in 1997.[9]
الاحتياطيات المحققة
Proven reserves are those reserves claimed to have a reasonable certainty (normally at least 90% confidence) of being recoverable under existing economic and political conditions, with existing technology. Industry specialists refer to this as "P90" (that is, having a 90% certainty of being produced). Proven reserves are also known in the industry as "1P".[10][11]
Proven reserves are further subdivided into "proven developed" (PD) and "proven undeveloped" (PUD).[11][12] PD reserves are reserves that can be produced with existing wells and perforations, or from additional reservoirs where minimal additional investment (operating expense) is required.[12] PUD reserves require additional capital investment (e.g., drilling new wells) to bring the oil to the surface.[10][12]
Until December 2009 "1P" proven reserves were the only type the U.S. Securities and Exchange Commission allowed oil companies to report to investors. Companies listed on U.S. stock exchanges must substantiate their claims, but many governments and national oil companies do not disclose verifying data to support their claims. Since January 2010 the SEC now allows companies to also provide additional optional information declaring 2P (both proven and probable) and 3P (proven plus probable plus possible) provided the evaluation is verified by qualified third party consultants, though many companies choose to use 2P and 3P estimates only for internal purposes.
الاحتياطيات الغير محققة
Unproven reserves are based on geological and/or engineering data similar to that used in estimates of proven reserves, but technical, contractual, or regulatory uncertainties preclude such reserves being classified as proven.[13] Unproven reserves may be used internally by oil companies and government agencies for future planning purposes but are not routinely compiled. They are sub-classified as probable and possible.[13]
Probable reserves are attributed to known accumulations and claim a 50% confidence level of recovery. Industry specialists refer to them as "P50" (i.e., having a 50% certainty of being produced). The sum of proven plus probable reserves is also referred to in the industry as "2P" (proven plus probable).[10]
Possible reserves are attributed to known accumulations that have a less likely chance of being recovered than probable reserves. This term is often used for reserves which are claimed to have at least a 10% certainty of being produced ("P10"). Reasons for classifying reserves as possible include varying interpretations of geology, reserves not producible at commercial rates, uncertainty due to reserve infill (seepage from adjacent areas) and projected reserves based on future recovery methods. The cumulative amount of proven, probable and possible resources are referred to in the industry as "3P" (proven plus probable plus possible).[10]
تصنيفات الاحتياطيات الروسية
In Russia, reserves categories A, B, and C1 correspond roughly to proved developed producing, proved developed nonproducing, and proved undeveloped, respectively; the designation ABC1 corresponds to proved reserves. The Russian category C2 includes probable and possible reserves.[14]
احتياطيات النفط الاستراتيجية
Many countries maintain government-controlled oil reserves for both economic and national security reasons. According to the United States Energy Information Administration, approximately 4.1 مليار برميل (650،000،000 m3) of oil are held in strategic reserves, of which 1.4 billion is government-controlled. These reserves are generally not counted when computing a nation's oil reserves.
تقنيات التقدير
The amount of oil in a subsurface reservoir is called oil in place (OIP).[12] Only a fraction of this oil can be recovered from a reservoir. This fraction is called the recovery factor.[12] The portion that can be recovered is considered to be a reserve. The portion that is not recoverable is not included unless and until methods are implemented to produce it. [13]
الطريقة الحجمية
Volumetric methods attempt to determine the amount of oil in place by using the size of the reservoir as well as the physical properties of its rocks and fluids. Then a recovery factor is assumed, using assumptions from fields with similar characteristics. OIP is multiplied by the recovery factor to arrive at a reserve number. Current recovery factors for oil fields around the world typically range between 10 and 60 percent; some are over 80 percent. The wide variance is due largely to the diversity of fluid and reservoir characteristics for different deposits.[15][16][17] The method is most useful early in the life of the reservoir, before significant production has occurred.
طريقة موازنة المواد
The materials balance method for an oil field uses an equation that relates the volume of oil, water and gas that has been produced from a reservoir and the change in reservoir pressure to calculate the remaining oil. It assumes that, as fluids from the reservoir are produced, there will be a change in the reservoir pressure that depends on the remaining volume of oil and gas. The method requires extensive pressure-volume-temperature analysis and an accurate pressure history of the field. It requires some production to occur (typically 5% to 10% of ultimate recovery), unless reliable pressure history can be used from a field with similar rock and fluid characteristics.[13]
طريقة منحنى تراجع الانتاج
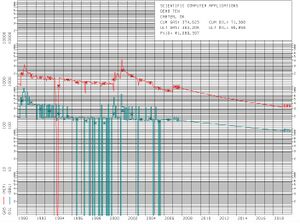
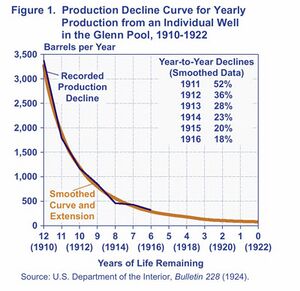
The decline curve method uses production data to fit a decline curve and estimate future oil production. The three most common forms of decline curves are exponential, hyperbolic, and harmonic. It is assumed that the production will decline on a reasonably smooth curve, and so allowances must be made for wells shut in and production restrictions. The curve can be expressed mathematically or plotted on a graph to estimate future production. It has the advantage of (implicitly) including all reservoir characteristics. It requires a sufficient history to establish a statistically significant trend, ideally when production is not curtailed by regulatory or other artificial conditions.[13]
نمو الاحتياطيات
Experience shows that initial estimates of the size of newly discovered oil fields are usually too low. As years pass, successive estimates of the ultimate recovery of fields tend to increase. The term reserve growth refers to the typical increases in estimated ultimate recovery that occur as oil fields are developed and produced.[4]
الاحتياطيات المقدرة حسب البلد
The unit bbl = barrel of oil. A sample calculation for the reserve/production ratio is for Venezuela.
| — | البلد | Reserves[19] 109 bbl |
Reserves 109 m3 |
Production[20] 106 bbl/d |
Production 103 m3/d |
Reserve/ Production Ratio1 years |
|---|---|---|---|---|---|---|
| 1 | 302.81 | 48.143 | 2.1 | 330 | 387 | |
| 2 | 267.03 | 42.454 | 8.9 | 1،410 | 82 | |
| 3 | 175.00 | 27.823 | 2.7 | 430 | 178 | |
| 4 | 155.60 | 24.738 | 4.1 | 650 | 101 | |
| 5 | 145.02 | 23.056 | 3.4 | 540 | 115 | |
| 6 | 101.50 | 16.137 | 2.3 | 370 | 27 | |
| 7 | 97.80 | 15.549 | 2.4 | 380 | 18 | |
| 8 | 80.00 | 12.719 | 10.0 | 1،590 | 15 | |
| 9 | 48.36 | 7.689 | 1.7 | 270 | 76 | |
| 10 | 36.97 | 5.878 | 2.5 | 400 | 41 | |
| 11 | 30.00 | 4.770 | 1.5 | 240 | 55 | |
| 12 | 25.41 | 4.040 | 1.1 | 170 | 62 | |
| 13 | 25.40 | 4.038 | 4.1 | 650 | 17 | |
| 14 | 25.00 | 3.975 | 7.0 | 1،110 | 10 | |
| 15 | 13.20 | 2.099 | 2.1 | 330 | 17 | |
| 16 | 12.20 | 1.940 | 1.7 | 270 | 15 | |
| 17 | 8.16 | 1.297 | 1.9 | 300 | 19 | |
| إجمالي أكبر 17 احتياطي | 1،540.43 | 244.909 | 59.5 | 9،460 | 71 | |
ملاحظات:
| ||||||
It is estimated that between 100 and 135 billion tonnes (which equals between 133 and 180 billions m3 of oil) of the world's oil reserves have been used between 1850 and the present.[21]
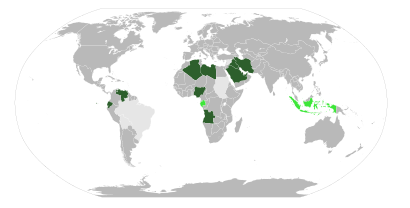
بلدان الأوپك
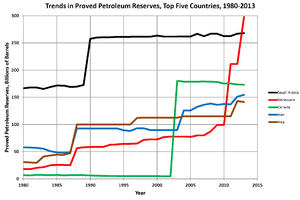
Since OPEC started to set production quotas on the basis of reserves levels in the 1980s, many of its members have reported significant increases in their official reserves.[22][23] There are doubts about the reliability of these estimates, which are not provided with any form of verification that meet external reporting standards.[22]
The sudden revisions in OPEC reserves, totaling nearly 300 bn barrels, have been much debated.[24] Some of it is defended partly by the shift in ownership of reserves away from international oil companies, some of whom were obliged to report reserves under conservative US Securities and Exchange Commission rules.[22][25] The most prominent explanation of the revisions is prompted by a change in OPEC rules which set production quotas (partly) on reserves. In any event, the revisions in official data had little to do with the actual discovery of new reserves.[22]
Total reserves in many OPEC countries hardly changed in the 1990s.[22] Official reserves in Kuwait, for example, were unchanged at 96.5 Gbbl (15.34×10⁹ m3) (including its share of the Neutral Zone) from 1991 to 2002, even though the country produced more than 8 Gbbl (1.3×10⁹ m3) and did not make any important new discoveries during that period.[22] The case of Saudi Arabia is also striking, with proven reserves estimated at between 260 and 264 مليار برميل (4.20×10¹⁰ m3) in the past 18 years, a variation of less than 2%,[22] while extracting approximately 60 مليار برميل (9.5×10⁹ m3) during this period.
Sadad al-Huseini, former head of exploration and production at Saudi Aramco, estimates 300 Gbbl (48×109 m3) of the world's 1،200 Gbbl (190×109 m3) of proven reserves should be recategorized as speculative resources, though he did not specify which countries had inflated their reserves.[26] Dr. Ali Samsam Bakhtiari, a former senior expert of the National Iranian Oil Company, has estimated that Iran, Iraq, Kuwait, Saudi Arabia and the United Arab Emirates have overstated reserves by a combined 320–390bn barrels and has said, "As for Iran, the usually accepted official 132 مليار برميل (2.10×10¹⁰ m3) is almost one hundred billion over any realistic assay."[27] Petroleum Intelligence Weekly reported that official confidential Kuwaiti documents estimate reserves of Kuwait were only 48 مليار برميل (7.6×10⁹ m3), of which half were proven and half were possible. The combined value of proven and possible is half of the official public estimate of proven reserves.[23]
In July 2011, OPEC's Annual Statistical Review showed Venezuela's reserves to be larger than Saudi Arabia's.[28][29]
انظر أيضاً
- تحليل منحنى التراجع
- احتياطيات النفط الاستراتيجية العالمية
- التنقيب عن النفط
- ذروة النفط
- صناعة النفط
- احتياطيات النفط الاستراتيجية
الطاقة والموارد:
- Petro-aggression
- أمن الطاقة
- World energy resources and consumption
- List of countries by natural gas proven reserves
المصادر
- ^ Society of Petroleum Engineers, Petroleum reserves and resources definitions, accessed 24 February 2017.
- ^ "Oil reserve definitions". bp.com. BP. Retrieved 4 December 2013.
- ^ أ ب "OPEC Share of World Oil Reserves 2010". OPEC. 2011.
- ^ أ ب David F. Morehouse (1997). "The Intricate Puzzle of Oil and Gas Reserves Growth" (PDF). U.S. Energy Information Administration. Archived (PDF) from the original on 6 August 2010. Retrieved 19 August 2014.
{{cite journal}}: Cite journal requires|journal=(help) - ^ "Proven Oil Reserves". moneyterms.co.uk. 2008. Retrieved 17 April 2008.
- ^ The Asylum, Leah McGrath Goodman, 2011, Harper Collins
- ^ Chestney, Nina (2021-05-18). "End new oil, gas and coal funding to reach net zero, says IEA". Reuters (in الإنجليزية). Retrieved 2022-06-08.
- ^ أ ب ت "Petroleum Resources Management System". Society of Petroleum Engineers. 2007. Retrieved 20 April 2008.
- ^ "Petroleum Reserves Definitions" (PDF). Petroleum Resources Management System. Society of Petroleum Engineers. 1997. Retrieved 20 April 2008.
- ^ أ ب ت ث "Glossary of Terms Used in Petroleum Reserves/Resources" (PDF). Society of Petroleum Engineers. 2005. Retrieved 20 April 2008.
- ^ أ ب Wright, Charlotte J.; Rebecca A Gallun (2008). Fundamentals of Oil & Gas Accounting (5 ed.). PenWell Books. p. 750. ISBN 978-1-59370-137-6.
- ^ أ ب ت ث ج Hyne, Norman J. (2001). Nontechnical Guide to Petroleum Geology, Exploration, Drilling and Production. PennWell Corporation. pp. 431–449. ISBN 9780878148233.
- ^ أ ب ت ث ج Lyons, William C. (2005). Standard Handbook Of Petroleum & Natural Gas Engineering. Gulf Professional Publishing. pp. 5–6. ISBN 9780750677851.
- ^ Society of Petroleum Engineers, SPE Reserves Committee,
- ^ "Defining the Limits of Oil Production". International Energy Outlook 2008. U.S. Department of Energy. June 2008. Archived from the original on 24 September 2008. Retrieved 22 November 2008.
- ^ E. Tzimas (2005). "Enhanced Oil Recovery using Carbon Dioxide in the European Energy System" (PDF). European Commission Joint Research Center. Archived from the original (PDF) on 7 April 2009. Retrieved 23 August 2008.
{{cite journal}}: Cite journal requires|journal=(help) - ^ Green, Don W.; Willhite, G. Paul (1998), Enhanced Oil Recovery, Society of Petroleum Engineers, ISBN 978-1555630775
- ^ "World Proved Reserves of Oil and Natural Gas". US Energy Information Administration. 2007. Retrieved 19 August 2008.
- ^ PennWell Corporation, Oil & Gas Journal, Vol. 105.48 (24 December 2007), except United States. Oil includes crude oil and condensate. Data for the United States are from the Energy Information Administration, U.S. Crude Oil, Natural Gas, and Natural Gas Liquids Reserves, 2006 Annual Report, DOE/EIA-0216(2007) (November 2007). Oil & Gas Journal's oil reserve estimate for Canada includes 5.392 مليار برميل (857،300،000 m3) of conventional crude oil and condensate reserves and 173.2 مليار برميل (2.754×10¹⁰ m3) of oil sands reserves. Information collated by EIA
- ^ U.S. Energy Information Administration (EIA) – U.S. Government – U.S. Dept. of Energy, September 2011 EIA - International Energy Statistics
- ^ How Much Oil Have We Used?, Science Daily, 8 May 2009. Retrieved Mar 2014.
- ^ أ ب ت ث ج ح خ WORLD ENERGY OUTLOOK 2005:Middle East and North Africa Insights (PDF). INTERNATIONAL ENERGY AGENCY. 2005. pp. 125–126. Archived from the original (PDF) on 28 May 2008. Retrieved 23 August 2008.
- ^ أ ب "Oil Reserves Accounting: The Case Of Kuwait". Petroleum Intelligence Weekly. 30 January 2006. Retrieved 23 August 2008.
- ^ Adam, Porter (15 July 2005). "How much oil do we really have?". BBC News.
- ^ Maugeri, Leonardo (23 January 2006). "The Saudis May Have Enough Oil". Newsweek.
- ^ "Oil reserves over-inflated by 300bn barrels – al-Huseini". 30 October 2007. Retrieved 23 August 2008.
- ^ "On Middle Eastern Oil Reserves". ASPO-USA's Peak Oil Review. 20 February 2006. Archived from the original on 12 February 2012. Retrieved 20 August 2008.
- ^ Faucon, Benoit (18 July 2011). "Venezuela Oil Reserves Surpassed Saudi Arabia In 2010-OPEC". Fox Business. Retrieved 18 July 2011.
- ^ "OPEC Share of World Crude Oil Reserves". OPEC. 2010. Retrieved 3 June 2012.
وصلات خارجية
- OPEC Annual Statistical Bulletin
- Energy Supply page on the Global Education Project web site, including many charts and graphs on the world's energy supply and use
- Oil reserves (most recent) by country
- Statistical Review of World Energy BP Statistical Review of Energy 2013
