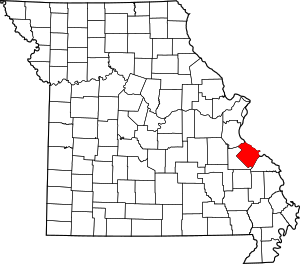
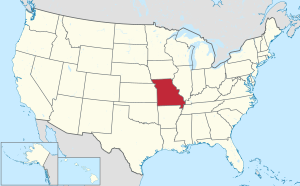
مقاطعة سانت جنڤييڤ، ميزوري
مقاطعة سانت جنڤييڤ إنگليزية: Sainte Genevieve County هي إحدى المقاطعات في ولاية ميزوري في الولايات المتحدة الأمريكية.
Ste. Genevieve County | |
|---|---|
 Location within the U.S. state of Missouri | |
 موقع Missouri ضمن الولايات المتحدة | |
| الإحداثيات: 37°53′36″N 90°12′12″W / 37.8933°N 90.2033°W | |
| البلد | |
| State | |
| تأسست | October 1, 1812 |
| السمِيْ | Saint Genevieve |
| Seat | Ste. Genevieve |
| Largest city | Ste. Genevieve |
| المساحة | |
| • الإجمالي | 509 ميل² (1٬318 كم²) |
| • البر | 502 ميل² (1٬301 كم²) |
| • الماء | 7 ميل² (17 كم²) 1.29%% |
| التعداد (2010) | |
| • الإجمالي | 18٬145 |
| • الكثافة | 36/sq mi (14/km2) |
| منطقة التوقيت | UTC−6 (Central) |
| • الصيف (التوقيت الصيفي) | UTC−5 (CDT) |
| Congressional district | 8th |
| الموقع الإلكتروني | stegencounty |
. . . . . . . . . . . . . . . . . . . . . . . . . . . . . . . . . . . . . . . . . . . . . . . . . . . . . . . . . . . . . . . . . . . . . . . . . . . . . . . . . . . . . . . . . . . . . . . . . . . . . . . . . . . . . . . . . . . . . . . . . . . . . . . . . . . . . . . . . . . . . . . . . . . . . . . . . . . . . . . . . . . . . . . .
الديمغرافيا
| التعداد تاريخياً | |||
|---|---|---|---|
| الإحصاء | التعداد | %± | |
| 1820 | 4٬962 | ||
| 1830 | 2٬186 | -55.9% | |
| 1840 | 3٬148 | 44.0% | |
| 1850 | 5٬313 | 68.8% | |
| 1860 | 8٬029 | 51.1% | |
| 1870 | 8٬384 | 4.4% | |
| 1880 | 10٬390 | 23.9% | |
| 1890 | 9٬883 | -4.9% | |
| 1900 | 10٬359 | 4.8% | |
| 1910 | 10٬607 | 2.4% | |
| 1920 | 9٬809 | -7.5% | |
| 1930 | 10٬097 | 2.9% | |
| 1940 | 10٬905 | 8.0% | |
| 1950 | 11٬237 | 3.0% | |
| 1960 | 12٬116 | 7.8% | |
| 1970 | 12٬867 | 6.2% | |
| 1980 | 15٬180 | 18.0% | |
| 1990 | 16٬037 | 5.6% | |
| 2000 | 17٬842 | 11.3% | |
| 2010 | 18٬145 | 1.7% | |
| تقديري 2012 | 17٬740 | -0.6% | |
2012 Estimate[2] | |||
المدن والبلدات
السياسة
المحلية
The Democratic Party completely controls politics at the local level in Ste. Genevieve County. Democrats hold every elected position in the county.
قالب:Missouri county elected officials
| Year | الجمهوري | الديمقراطي | Third Parties |
|---|---|---|---|
| 2012 | 36.15% 2,878 | 61.35% 4,884 | 2.50% 199 |
| 2008 | 32.87% 2,861 | 65.48% 5,699 | 1.65% 144 |
| 2004 | 46.90% 3,845 | 51.32% 4,208 | 1.78% 146 |
| 2000 | 48.36% 3,525 | 48.76% 3,554 | 2.88% 210 |
| 1996 | 37.31% 2,515 | 60.23% 4,060 | 2.46% 166 |
| 1992 | 33.97% 2,372 | 66.03% 4,610 | 0.00% 0 |
| 1988 | 55.65% 3,437 | 43.57% 2,691 | 0.78% 48 |
| 1984 | 51.53% 3,070 | 48.47% 2,888 | 0.00% 0 |
| 1980 | 40.19% 2,490 | 59.60% 3,692 | 0.21% 13 |
| 1976 | 42.21% 2,260 | 57.70% 3,089 | 0.09% 5 |
الفدرالية
| U.S. House of Representatives - District 8 – Ste. Genevieve County (2012) | |||||
|---|---|---|---|---|---|
| الحزب | المرشح | الأصوات | % | ±% | |
| Republican | Jo Ann Emerson | 4,711 | 60.97 | ||
| Democratic | Jack Rushin | 2,761 | 35.73 | ||
| Libertarian | Rick Vandeven | 255 | 3.30 | ||
| U.S. House of Representatives - District 8 - Special Election – Ste. Genevieve County (2013) | |||||
|---|---|---|---|---|---|
| الحزب | المرشح | الأصوات | % | ±% | |
| Republican | Jason T. Smith | 579 | 54.37 | ||
| Democratic | Steve Hodges | 451 | 42.35 | ||
| Constitution | Doug Enyart | 17 | 1.60 | ||
| Libertarian | Bill Slantz | 12 | 1.13 | ||
| Write-In | Wayne L. Byington | 6 | 0.56 | ||
الثقافة السياسية
| Year | الجمهوري | الديمقراطي | Third Parties |
|---|---|---|---|
| 2012 | 50.25% 4,055 | 47.25% 3,813 | 2.50% 202 |
| 2008 | 42.29% 3,732 | 56.42% 4,979 | 1.29% 114 |
| 2004 | 46.54% 3,791 | 52.55% 4,281 | 0.91% 74 |
| 2000 | 47.94% 3,505 | 49.24% 3,600 | 2.82% 206 |
| 1996 | 30.89% 2,078 | 53.47% 3,597 | 15.64% 1,052 |
| 1992 | 24.94% 1,780 | 53.17% 3,795 | 21.68% 1,547 |
| 1988 | 41.08% 2,532 | 58.60% 3,612 | 0.32% 20 |
| 1984 | 54.37% 3,245 | 45.63% 2,723 | 0.00% 0 |
| 1980 | 44.00% 2,768 | 52.84% 3,324 | 3.16% 199 |
| 1976 | 41.72% 2,241 | 57.54% 3,091 | 0.74% 40 |
انظر أيضاً
الهامش
- ^ "U.S. Decennial Census". Census.gov. Retrieved September 14, 2013.
- ^ خطأ استشهاد: وسم
<ref>غير صحيح؛ لا نص تم توفيره للمراجع المسماةQF
وصلات خارجية
- Digitized 1930 Plat Book of Ste. Genevieve County from University of Missouri Division of Special Collections, Archives, and Rare Books
قالب:Ste. Genevieve County, Missouri قالب:Geographical features of Ste. Genevieve County, Missouri